Education and training authorisation and monitoring activity September 2020 - August 2021
14 December 2022
Introduction and overview 2020-21
We have a statutory responsibility for the education and training of solicitors, as set out in the Solicitors Act 1974 and the Legal Services Act 2007. These requirements are a key regulatory tool to protect consumers of legal services.
This report shows the quality assurance activity in relation to education and training. It covers the period 1 September 2020 to 31 August 2021 (unless otherwise stated).
In September 2021, we introduced a new single assessment for all aspiring solicitors, the Solicitors Qualifying Examination (SQE). This will mean that everyone who becomes a solicitor will have been assessed in a consistent way against the same high standards. The first sittings took place in November 2021 (SQE1) and April 2022 (SQE2).
To prepare for the SQE we introduced transition regulations as part of our Standards and Regulations. These allow anyone who was already studying, or training, when the SQE was introduced, to continue to qualify through the Legal Practice Course (LPC) route. This the pre-SQE system where someone has a qualifying law degree (QLD) or the Common Professional Examination (CPE).
This means there could potentially be people qualifying through the LPC routes for some years up until 2032. However, we expect most LPC courses to start coming to an end over the next few years.
We have arrangements in place for the orderly closure of LPC courses. We will continue to monitor, and report on our work on the LPC routes, so long can student numbers remain high enough to do so. We know that we must remain vigilant to the risks to quality and standards as these courses come to an end.
These regulations also mean CPE students can only do the LPC if they accepted their course offer before 1 September 2021. They must have also started the course by 31 December 2021,unless they meet the transitional arrangements in another way, for example, they accepted an offer of a period of recognised training by 1 September 2021.
This report covers a period when Covid-19 restrictions were in place. We relaxed some of our teaching and assessment requirements for the QLD, CPE and LPC at the start of the pandemic in 2020. These then carried on for the whole of the 2020/21 academic year.
We continued to allow some flexibility in how courses were taught and assessed in academic year 2021/22 in limited circumstances. This was where we were satisfied that the arrangements put in place by providers maintained the security and integrity of the qualification.
For the QLD and the CPE, we do not specify the form that the assessments take. During the pandemic, we required the providers to make sure that an assessment was taken.
For the LPC we permitted alternative assessment arrangements during the pandemic, for example, assessment using coursework, rather than the usual exam arrangements.
For the core LPC subjects, we maintained our requirements for supervised assessment but decided to permit remote proctoring of supervised assessments. This was to protect the integrity and security of assessments. We put in place a process to allow LPC providers to apply to us for temporary approval of changes to their arrangements.
During the pandemic we worked closely with providers. We kept them up to date with our requirements through emails and information on our website.
We also hosted four LPC workshops throughout 2020/21 to support providers’ understanding of our requirements. We used these to get feedback on how their arrangements were working and allow them to share their experiences with each other.
The vast majority of those who qualify as solicitors under the LPC route will have completed:
- The academic stage of training - QLD or CPE (also known as the Graduate Diploma in Law).
- The vocational stage of training - the LPC, period of recognised training (PRT) and Professional Skills Course (PSC).
This report is based on information we receive from the course providers that we approve or authorise. It also considers information we hold on the qualification routes through which people have been admitted.
Key findings
The number of students taking the LPC during 2020/21 remained in line with previous years. However the number of people taking the CPE increased significantly - up by 26%.
Successful completion of the LPC fell slightly during 202/21 compared to previous years - 53.5% of students passed in 2020/21, compared to 57.7% in 2019/20. A further 37% did not complete the LPC during 2020/21, compared to 28% in 2019/20 and 13% during 2018/19.
This fall in completions can be attributed to the increase in students who referred or deferred due to Covid-19. Referred are those who didn't pass but may have still additional attempts available, such as resitting an assessment. While deferred means they have postponed it. These students may successfully go on to complete the LPC in future.
Those completing the CPE also fell compared with the year before – 49.6% of students passed in 2020/21 compared to 58.9% in 2019/20.
Like the LPC, there was a significant increase of students who did not complete the CPE - 40% in 2020/21, compared to 22% in 2019/20 and 15% during 2018/19.
There continued to be significant differences in the successful completion rates between providers, with pass rates for the LPC ranging from 100% to 1%. Two providers reported student numbers which have been included in totals but did not report results and classification. They account for 2% of students.
Different factors may have influenced pass rates, including student ability and engagement, teaching quality and assessment arrangements. But we are unable to draw firm conclusions from the data available.
There are also significant differences between providers in the proportion of students who achieve pass, commendation or distinction grades.
Data shows that students from Black, Asian and minority ethnic groups are less likely to successfully complete the CPE and the LPC. This has been the case throughout our monitoring.
This attainment gap is widely seen across higher education and other professional assessments. We have commissioned external research to better understand the reasons for this gap in professional assessments.
Male and female students appear to perform equally well on the CPE and LPC, and women outnumber men on both courses and at the point of admission.
Our data on ethnicity and disability for those undertaking PRTs is less comprehensive. As shown in the charts in the 'routes to qualification' section , large numbers of training contracts indicated ethnicity as 'unknown' and few declared a disability.
Numbers admitted by route
Figure 1 below sets out the routes to qualification as a solicitor under the training regulations for the LPC route (which was replaced by the SQE on 1 September 2021). This route takes a minimum of six years for those who study full time and undertake a PRT of two years (full time).
Figure 1 illustrates the routes available to legal executives and lawyers qualified in the UK or international jurisdictions before 1 September 2021.
Figure 1: Routes to qualification before 1 September 2021
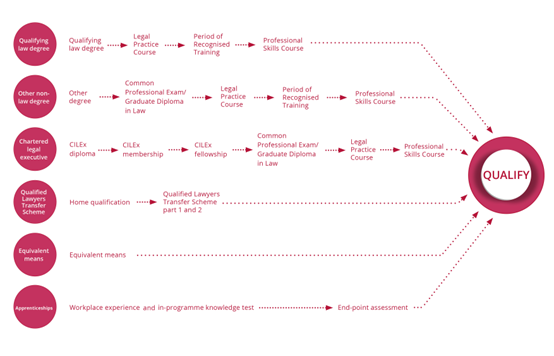
Figure 2: Numbers admitted to the roll by route
| 12 months to end of… | LPC | Qualified Lawyers Transfer Test | Qualified Lawyers Transfer Scheme | Chartered Institute of Legal Executive routes | Other | Total |
|---|---|---|---|---|---|---|
| October 2015 | 5,327 | 89 | 441 | 136 | 35 | 6,028 |
| October 2016 | 5,420 | 36 | 580 | 239 | 38 | 6,313 |
| October 2017 | 5,566 | 27 | 673 | 228 | 58 | 6,552 |
| October 2018 | 5,713 | 8 | 714 | 319 | 30 | 6,784 |
| October 2019 | 5,756 | 16 | 814 | 345 | 69 | 7,000 |
| October 2020 | 5,475 | 5 | 606 | 323 | 312 | 6,723 |
| October 2021 | 5,725 | 9 | 691 | 352 | 399 | 7,176 |
Key findings
- 7,176 solicitors were admitted
- Approximately 80% of those admitted followed the LPC route to qualification.
- The Qualified Lawyer Transfer Test (QLTT) and Qualified Lawyers Transfer Scheme (QLTS) account for approximately 10% of those admitted.
- The number for ‘other’ is higher this year than previous years. This is partly explained by the 31 December deadline for eligible registered European lawyers to apply to become solicitors. This was due to the UK’s exit from the European Union.
The QLTS was a two-stage assessment of the knowledge and skills needed to be a solicitor. It was the route to admission for barristers of England and Wales and lawyers qualified in other jurisdictions wishing to become solicitors. Like the LPC route, this was replaced by SQE on 1 September 2021. Find out more about the QLTS results.
The QLTS assessment replaced the QLTT in 2010. However, candidates who completed the QLTT may still apply for admission, so a small number are still admitted by this route.
Providers of legal education and training
Providers range from universities that offer only the QLD to those who offer a full range of pre and post qualification courses. All education providers that we authorise are subject to review by the Quality Assurance Agency for Higher Education (QAA).
QLD and CPE course providers are required to confirm to us that they meet the requirements of the Academic Stage Handbook if they wish to:
- validate new programmes
- revalidate existing programmes
- make major modification to existing programmes.
This Handbook sets out the requirements for all QLDs, CPEs and Exempting Law Degrees that lead to the completion of the academic stage of training.
These arrangements will continue to apply to all approved programmes beginning on or before 31 December 2021. And until students have completed their course in accordance with the requirements of the SRA's Academic Stage Handbook.
We have not approved or recognised and will not monitor any new QLD or CPE courses that started after 31 December 2021.
PRT takes place in firms and organisations that we authorise to provide training.
When monitoring the quality and standards of education and training we focus on the two professional qualifications for the LPC route to qualification (the CPE and LPC).
Our monitoring involves initial approval (CPE) or authorisation (LPC). Each provider must also submit to us an annual course monitoring report consisting of monitoring data and a narrative report. We review these reports, and if issues are identified, we follow up with the provider. We have the power to undertake a monitoring visit if necessary.
We are committed to improving our understanding of, and encouraging, equality and diversity in the solicitors’ profession. In 2019/20, we expanded the information that we ask providers to collect about students on the LPC. This now includes socio-economic data from LPC students.
We also made changes to the way we collect data about disability and gender, for example we now include options for where respondents prefer not to say. This additional information and data will help us evaluate the impact of the SQE.
The socio-economic data for 2020/21 includes a large number of ‘unknown’ responses, as was the case in 2019/20. While these have decreased from last year (2019/20), the ‘unknowns’ limits our ability to draw conclusions from the data. We will work with providers to understand how we can improve the quality of the data for future years.
We have included some limited information on the breakdown of LPC students by two socio-economic categories:
- The type of school that students mainly attended between the ages of 11 and 16.
- The highest level of qualifications achieved by their parents or guardians by the time the student was 18.
While around a third of the responses to these questions were ‘unknown’, we can provide some indication of the socio-economic background of the students taking the LPC.
In summary, for the LPC, the figures indicate that overall, in 2020/21:
- 8,046 (5% of enrolled students) successfully completed the LPC (compared with 57.5% in 2019/20)
- 1% failed the LPC in 2020/21
- The remaining students were either withdrawn or suspended or were referred or deferred from their assessments.
In summary, for the CPE, the figures indicate that overall, in 2020/21:
- 3,591 (49.6% of enrolled students) successfully completed the CPE (compared with 58.9% in 2019/20)
- 3% failed the CPE in 2020/21
- The remaining students were either withdrawn or suspended or were referred or deferred from their assessments.
LPC results by provider
Figure 3: LPC results by provider
Successful completion rates by provider vary from 1% to 100%. Providers did not report final results and classification for 5% of students and two providers reported student numbers but no results.
In addition to varying completion rates, there is significant variation in the proportion of students obtaining pass, commendation and distinction grades. It is unclear what the reasons are for such a wide disparity in performance.
There was an increase in the number of deferrals for the second year running – 36.8% of students deferred during 2020/21 compared to 28% during 2019/20 and 13% during 2018/19. This is likely to be due to students choosing to wait to sit assessments face to face, rather than take assessments remotely, or for other reasons relating to the pandemic.
There may also be variation in:
- academic ability between different intakes
- variable quality of teaching
- different approaches to assessment.
This makes it difficult to be confident about consistent outcomes and are among the key reasons for the introduction of the SQE.
There are also very large differences in the student cohort sizes of different LPC providers. LPC groups range from fewer than ten students to many thousands of students, spread over different provider locations.
The largest providers, BPP University and the University of Law, offer the LPC across different locations. Between them, they shared 81% of the total number of students enrolled to take assessments in 2020/21. This remains consistent with previous years.
LPC results by gender
Figure 4: LPC results by gender
Our data shows 67% of students in this cohort were female, 32% were male. Figure 4 above does not include the 1% who identified as 'other' or 'preferred not to say'.
There remains little difference in performance on the LPC between male and female – 54% of male students and 54% of female students passed. Male and female students continue to receive similar rates of distinctions, commendations and pass grades.
LPC results by ethnicity
Figure 5: LPC results by ethnicity
The data shows that:
- 21% of students identified themselves as Asian/Asian British, compared to 23% in 2019/20
- 10% of students identified as Black/African/Caribbean/Black British, compared to 12% in 2019/20
- 5% of students identified as being from mixed/multiple ethnic groups, the same as 2019/20
- Students from Black, Asian and minority ethnic backgrounds were less likely to obtain a distinction in the LPC than White students.
- Successful completion of the LPC for each ethnicity group was: 62% White
- 46% Asian/Asian British
- 34% Black/African/Caribbean/Black British
- 51% of those from mixed / multiple ethnic groups.
This attainment gap is widely seen across higher education and other professional assessments. We have commissioned external research to better understand the reasons for this gap in professional assessments.
LPC results by disability
Figure 6: LPC results by disability
Approximately 19% of students identified themselves as having a disability.
A further 0.3% preferred not to say - although this does not necessarily reflect the proportion of students who had special arrangements for learning and assessment.
Of those who identify themselves as having a disability, 24% identified as having learning disability or difficulty.
LPC results by socio-economic categories
It is difficult to draw any firm conclusions about the data we collected on socio economic categories. This is because around a third of responses to these questions were 'unknown', meaning that the provider did not know the answer.
However, the data we collected indicated that:
- 21% of students identified themselves as attending state-run/state-funded - non selective or selective schools.
- Approximately 7% attended an independent or fee-paying school.
- While a smaller proportion of students attended independent or fee-paying schools without a bursary, these students were most likely to pass the LPC and most likely to pass with a distinction.
- 24% of students enrolled onto the LPC identified themselves as having at least one parent or guardian with a degree level qualification.
- Approximately 7% of students reported parents or guardians with no formal qualifications.
- 30% of students who completed the LPC had at least one parent or guardian with a degree level qualification.
Summary of narrative reports from LPC providers
All LPC providers must provide us with a narrative annual report on the LPC course. In addition, providers appoint their own external examiners to review the quality and standards of their assessments.
In this narrative they include a summary and analysis of issues raised by the external examiners and the provider's response to those issues. We also ask providers to send copies of the full external examiners’ reports to us.
Although we prescribe a template for the narrative report, there are differences in the amount of information provided by different providers.
Almost all providers saw an increase in the number of full-time LPC students and a decrease in the number of part-time LPC students compared to last year.
The narrative reports covered the approach taken by providers to delivering the LPC during the pandemic.
During the pandemic we allowed remote teaching and remote assessment for the LPC on a temporary basis. Providers applied to us for approval of temporary remote assessment arrangements for the 2020/21 academic year.
In April 2021 our Board agreed that we would allow providers to offer students the option to be assessed remotely on a permanent basis (subject to our approval). During 2020/21 we approved one LPC provider to offer remote assessment on a permanent basis.
All providers took a similar approach to delivery of the LPC during 2020/21, offering a number of teaching methods, which included:
- synchronous teaching (also recorded and made available to all students)
- asynchronous teaching (where learning is accessed online at the same time as it is being delivered)
- independent tasks for students to complete with recorded and written feedback provided
- online workshops (with the use of ‘breakout rooms’)
- drop-in sessions
- additional written online resources
- face-to-face teaching where government restrictions permitted.
We allowed the use of several different types of remote proctoring software for assessment of the LPC. We only agreed to providers using software where we were satisfied that the security and integrity of the assessment would be maintained.
Generally, the switch to remote proctoring for LPC assessments during 2020/21 was smooth. However, there were some issues that providers reported to us:
- assessments timing had been incorrectly set and the assessment timed out
- documentation forming part of the assessment would not open
- issues with firewalls
- general unreliability of network connections.
To help mitigate these issues, most providers introduced a minimum specification for technology. They also required students to test software prior to assessments and offered students a test environment and help videos. Students who were digitally disadvantaged also had access to hardship funding.
The external examiners were largely positive about the LPC overall and feedback included:
- the standard of the provision of information and additional support to students during Covid-19 restrictions
- the quality and consistency of marking and moderation
- assessment processes measuring achievement appropriately against the intended learning outcomes
- issues identified in previous years being promptly and effectively resolved
- learning and teaching strategies and materials
- good student feedback and prompt resolution of complaints.
Some external examiners identified general areas of concern, including:
- administrative issues for external examiners
- staffing issues, which were subsequently resolved
- being unable to visit campuses and speak to students due to restrictions.
We worked closely with providers during the year to address any issues as they arose.
CPE results by provider
Figure 7: CPE results by provider
The total number of CPE students able to complete the course was 7,234 (compared with 5,723 in the previous academic year). This includes:
- full-time students enrolling for the first time in September 2020 (or later)
- part-time students in their second year of study
- students who had deferred assessment attempts.
The overall completion rate in 2020/21 was 50% compared to 60% in 2019/20. This is likely due to the impact of the pandemic and is reflected in the number of deferrals in 202/21.
The CPE is also offered by a range of providers, all of which are also subject to reviewed by QAA. The size of the student cohort varies considerably.
The largest providers, BPP University and the University of Law, offer the CPE across a range of locations. As with the LPC, BPP and the University of Law dominate the market.
Rates of successful completion of the CPE by provider shown in figure 9 also vary significantly, from 23% to 93%. It is difficult to draw firm conclusions about the reasons for the significant difference in pass rates by provider.
As well as the size variations, the pass rate differences might be explained by the students ability, differences in teaching quality and in the approach to assessment.
There was a significant increase in the number of deferrals compared to previous years - 40% of students deferred during 2020/21 compared to 22% during 2019/20.
This is likely due to candidates choosing to wait to sit assessments face to face, rather than remotely, or other reasons relating to the pandemic.
Providers supply us with a summary and evaluation of issues raised by their external examiners in their annual narrative reports. These did not raise any concerns about quality and standards on the CPE.
CPE results by gender
Figure 8: CPE results by gender
These numbers indicate a largely consistent performance in the CPE by gender. Of this group 39% of students were men and 61% women.
Figure 8 above does not include the fewer than 1% who answered this question as 'preferred not to say'.
The successful completion rate for male students was 19% and for female students 31%. This shows a significant fall in completion rate compared to previous years, (38% of male and 62% of female students completed in 2019/20). This can be attributed to the continuing pandemic and numbers of students who referred or deferred.
CPE results by ethnicity
Figure 9: CPE results by ethnicity
The breakdown of the CPE results by ethnicity included 17% who identify as Asian/Asian British, 8% Black/African/Caribbean/Black British and 5% as mixed/multiple ethnic groups.
As with the LPC, these numbers indicate that students from Black, Asian and minority ethnic backgrounds were less likely to pass the CPE in 2020/21. This attainment gap is widely seen across higher education and other professional assessments. We have commissioned external research to better understand the reasons for this gap in professional assessments.
White students formed approximately 54% of the cohort and had a successful completion rate of 57%.
Asian/Asian British students accounted for 17% of the cohort and had a successful completion rate of 41%.
Black (African/Caribbean/Black British) formed 8% of the cohort and the successful completion rate was 29%.
CPE results by disability
Figure 10: CPE results by disability
Approximately 22% of students identified themselves as having a disability, compared with 14% last year. Although this does not necessarily reflect the proportion of students who had special arrangements for learning and assessment.
The successful completion rate for students declaring a disability was 43%, in comparison with 52% for students who did not declare a disability.
The final stage of the qualification pathway is to complete a period of recognised training (PRT) and is also when trainees will also undertake the PSC.
Training takes place in a firm or other type of organisation that we have approved to take in trainees. If the training is carried out on a full-time basis, it will usually take two years.
The following tables provide details of the number of training contracts registered with us in 2020/21, compared to the preceding three years. This is broken down by age, ethnicity, disability and gender. Percentages are based on the total known population.
The figures shown are for the start of a PRT. Some individuals may not complete the PRT or may start one more than once.
This accounts for a small difference in the total number of PRTs and the numbers for those shown at figure 2 to have been admitted having taken the LPC.
Figure 11: PRT age breakdown
| 2017/18 | 2018/19 | 2019/20 | 2020/21 | |||||
|---|---|---|---|---|---|---|---|---|
| Age | Count | % | Count | % | Count | % | Count | % |
| 18 - 21 | 40 | 1% | 44 | 1% | 31 | 1% | 43 | 1% |
| 22 - 25 | 3,422 | 57% | 3,485 | 57% | 3,514 | 58% | 3,372 | 57% |
| 26 - 30 | 1,821 | 30% | 1,798 | 30% | 1,789 | 30% | 1,807 | 30% |
| 31 - 35 | 391 | 7% | 399 | 7% | 378 | 6% | 375 | 6% |
| 36 - 40 | 150 | 3% | 165 | 3% | 157 | 3% | 150 | 3% |
| 41 - 45 | 85 | 1% | 86 | 1% | 86 | 1% | 106 | 2% |
| 46 - 50 | 37 | 1% | 53 | 1% | 54 | 1% | 47 | 1% |
| 51 - 55 | 25 | 0% | 24 | 0% | 22 | 0% | 22 | 0% |
| 55+ | 7 | 0% | 16 | 0% | 15 | 0% | 16 | 0% |
| Total known | 5,978 | 100% | 6,070 | 100% | 6,046 | 100% | 5,938 | 100% |
| Declaration rate | 100% | 100% | 100% | 100% | ||||
| Unknown | 1 | 0% | 2 | 0% | 1 | 0% | 0% | |
| Total | 5,979 | 100% | 6,072 | 100% | 6,047 | 100% | 5,938 | 100% |
Figure 11 shows that the spread of the age of those taking a PRT has remained broadly stable over a four-year period. For 2020/21, 88% of the training contracts registered with us were for those aged 30 or under.
Figure 12: PRT ethnicity breakdown
| 2017/18 | 2018/19 | 2019/20 | 2020/21 | |||||
|---|---|---|---|---|---|---|---|---|
| Ethnicity | Count | % | Count | % | Count | % | Count | % |
| Black, Asian and minority ethnic | 598 | 30% | 506 | 39% | 188 | 31% | 52 | 32% |
| Asian | 376 | 19% | 291 | 16% | 111 | 18% | ||
| Black | 91 | 5% | 81 | 4% | 28 | 5% | ||
| Mixed / multiple ethnic groups | 81 | 4% | 82 | 5% | 26 | 4% | ||
| Other ethnic group | 50 | 3% | 52 | 3% | 23 | 4% | ||
| White | 1,371 | 70% | 1,303 | 72% | 422 | 69% | 111 | 68% |
| Total known | 1,969 | 100% | 1,809 | 100% | 610 | 100% | 163 | 100% |
| Total known | 5,978 | 100% | 6,070 | 100% | 6,046 | 100% | 5,938 | 100% |
| Declaration rate | 100% | 100% | 100% | 100% | ||||
| Unknown | 4,010 | 67% | 4,263 | 70% | 5,437 | 90% | 5,775 | 97 % |
| Total | 5,979 | 100% | 6,072 | 100% | 6,047 | 100% | 5,938 | 100% |
Figure 12 shows that for 97% of trainees, their ethnicity is recorded as 'unknown' in 2020/21. This is because we do not require this data from trainees.
Where the ethnicity is known, it is likely they have now been admitted and so they can now give us their data via their mySRA profile. Or they were known to us previously for another reason.
This is a gap in our understanding of our trainee solicitor population and the progression of students from university into workplace learning.
We have reviewed our data collection for the SQE to help us better understand the diversity and socio-economic background of aspiring solicitors.
Due to data migration, it is not possible to identify a 'no' from an unanswered question for disability.
Figure 13: PRT disability declared
| 2017/18 | 2018/19 | 2019/20 | 2020/21 | |||||
|---|---|---|---|---|---|---|---|---|
| Count | % | Count | % | Count | % | Count | % | |
| Disability declared | 87 | 1% | 97 | 2% | 43 | 1% | 22 | 0.37% |
| Total | 5,979 | 100% | 6,072 | 100% | 6,047 | 100% | 5,938 | 99.63% |
Numbers declaring a disability continue to be very low as we do not require this data from trainees.
Figure 14: PRT gender breakdown
| 2017/18 | 2018/19 | 2019/20 | 2020/21 | |||||
|---|---|---|---|---|---|---|---|---|
| Gender | Count | % | Count | % | Count | % | Count | % |
| Female | 3,698 | 65% | 1,679 | 68% | 436 | 67% | 102 | 61% |
| Male | 2,000 | 35% | 797 | 32% | 211 | 33% | 64 | 39% |
| Total known | 5,698 | 100% | 2,476 | 100% | 647 | 100% | 166 | 100% |
| Declaration rate | 95% | 41% | 11% | 3% | ||||
| Unknown | 281 | 5% | 3,596 | 59% | 5,400 | 89% | 5,772 | 97% |
| Total | 5,979 | 100% | 6,072 | 100% | 6,047 | 100% | 5,938 | 100% |
This data shows that employers continue to recruit more female than male trainees although the percentage who declared their gender to us was low.
We have replaced the QLTS route to admission with the SQE. Unless they have already started on the QLTS route all qualified lawyers can now only be admitted as a solicitor by taking all or part of the SQE.
The QLTS information in this report is for January 2021- April 2022 and covers the last QLTS assessments.
The QLTS assesses an individual's competence through:
- a multiple-choice testing (MCT) of legal knowledge
- a skills-based assessment, called the objective structured clinical examination (OSCE).
Candidates must pass the MCT before being able to progress to the OSCE. The assessments were delivered by Kaplan and the MCT assessment was offered at multiple centres around the world. The OSCE assessments only took place in London.
Between January 2021 and the final MCT assessment in July 2021, 3,232 candidates attempted the assessment.
A further 1,874 candidates sat the OSCE between April 2021 and the final sitting in April 2022. Pass rates are shown in figure 15.
The delivery of all QLTS exams and assessments in 2021 were impacted by Covid-19 pandemic. The MCT was delivered in January 2021 and July 2021. As usual, this was through Pearson Vue test centres but with social distancing requirements enforced.
The OSCE was delivered in April 2021, July 2021, November 2021 and March/April 2022. This was done successfully with social distancing and other safeguards in place.
We saw a significant increase in the numbers of candidates taking the MCT and OSCE in comparison to previous years.
There was an increase in taking the assessments between January 2021 and April 2022 - 57% more sat the MCT (compared to 2019/20) and 164% more took the OSCE. This is likely due to the introduction of SQE.
QLTS results data and percentage pass rates (calendar year 2021 and 2022)
The numbers are of candidates sitting the assessment, while percentages are pass rate in each group. The latter also includes those who were exempt from parts of the assessment.
Figure 15: QLTS results data and percentage pass rates (calendar year 2021 and 2022)
| MCT | OSCE | ||
|---|---|---|---|
| Date | Pass rates | Date | Pass rates |
| January 2021 | 64.7% | April/May 2021 | 69.4% |
| July 2021 | 50.2% | July/August 2021 | 77% |
| November/December 2021 | 69.7% | ||
| March/April 2022 | 76% | ||
| Assessment | Number of candidates | Male | Female | Not stated |
|---|---|---|---|---|
| MCT | 3,232 | 1,294 (57.1%) | 1,886 (53.6%) | 52 (1.6%) |
| OSCE | 1,874 | 722 (70.6%) | 1,196 (74.2%) | 33 (1.8%) |
| Assessment | Number of candidates | Black, Asian and minority ethnic | White | Not stated |
|---|---|---|---|---|
| MCT | 3,232 | 1,900 (52.0%) | 866 (59.8%) | 46 (14.4%) |
| OSCE | 1,874 | 875 (69%) | 702 (76.1%) | 297 (15.8%) |
| Assessment | Number of candidates | Yes | No | Not stated |
|---|---|---|---|---|
| MCT | 3,232 | 1,319 (60.3%) | 1,913 (51.8%) | N/A |
| OSCE | 1,874 | 826 (78.8%) | 1,048 (68.2%) | N/A |
| Assessment | Number of candidates | Yes | No | Not stated |
|---|---|---|---|---|
| MCT | 3,232 | 39 (46.2%) | 3,193 (55.4%) | N/A |
| OSCE | 1,874 | 43 (65.1%) | 1,831 (73.1%) | N/A |
Candidates from 111 jurisdictions took an assessment in 2021/22. There more than 170 recognised jurisdictions for QLTS, which include, as separate jurisdictions, the states of America and territories of Canada.
The overall pass rate for both assessments varied depending on the sitting. For these, 57.1% of male candidates and 53.6% female who sat the MCT were successful. The pass rate for the OSCE was 70.6% for male candidates and 74.2% for female candidates.
For the MCT, 39 candidates declared a disability and 43 for the OSCE.
The pass rate on the MCT for White candidates was 59.8%, whereas for Black, Asian and minority ethnic candidates was 52%.
We also have information about the first language of candidates. The MCT pass rate for those with English as their first language was 60.3%, whereas for those for do not, it was 51.8%.
Once candidates have passed the MCT, the gap in performance by ethnic group remains similar in the OSCE. The pass rate is 76.1% for White candidates and 69% for Black, Asian and minority ethnic candidates.
It is also consistent for candidates whose first language is not English - 68.2% compared to 78.8% for those where it is.
Aspiring solicitors can also meet the academic or vocational requirements of training by an equivalent means application.
We may recognise prior learning and grant exemptions where:
- the level, standard, volume and content of prior learning achieved is equivalent to all or part of a stage of education and training
- there is relevant, sufficient and adequate evidence of such achievement.
We may also grant exemptions based on prior experiential learning. The key principle is that we recognise the achievement of learning and outcomes, not simply evidence that an applicant has had experience of something.
The number of those qualifying this way has been steadily increasing. Figure 18 shows the number who qualified with part of their training satisfied through equivalent means.
Individuals can continue to apply to qualify through equivalent means during the transition period following the introduction of the SQE. However, we do expect these numbers to begin to fall from 2021 onwards.
Figure 16: Number of individuals who qualified through equivalent means 2015/16 to 2020/21
| 2015/16 | 2016/17 | 2017/18 | 2018/19 | 2019/20 | 2020/21 |
|---|---|---|---|---|---|
| 66 | 71 | 85 | 88 | 99 | 111 |
These figures are for our financial year: 1 November to 31 October.