Diversity in law firms' workforce
11 March 2026
Executive summary

We are committed to encouraging equality, diversity and inclusion in the legal profession in line with our legal and regulatory responsibilities. A diverse and representative legal workforce is better for the profession and for the public it serves. It means improved choice and a better experience for people using legal services. Diversity can also bring commercial and other benefits to law firms.
This report covers solicitors and other employees working in SRA-regulated law firms in England and Wales. It is based on diversity data collected from almost 100% of firms in summer 2025.
We have two interactive tools you can also use to explore our data:
- one that shows all the data for 2025 that firms can use to benchmark their own data
- another that shows all the firm diversity data we have collected since 2015 so that trends can be seen visually.
A separate report on diversity in Welsh law firms is also available.
Using data to inform and drive change
Having good quality data about diversity in the profession helps us and others understand and address any challenges in achieving a diverse and inclusive legal workforce. We use this data to inform our regulatory approach and the work we do to encourage equality, diversity and inclusion in the profession. It allows us to monitor progress and informs research and publications produced by us and others.
Key firm diversity data headlines
In this summary, we provide highlights for each characteristic we collected data about in 2025. More detail can be found in the full report below and the firm diversity data tools.
Sex
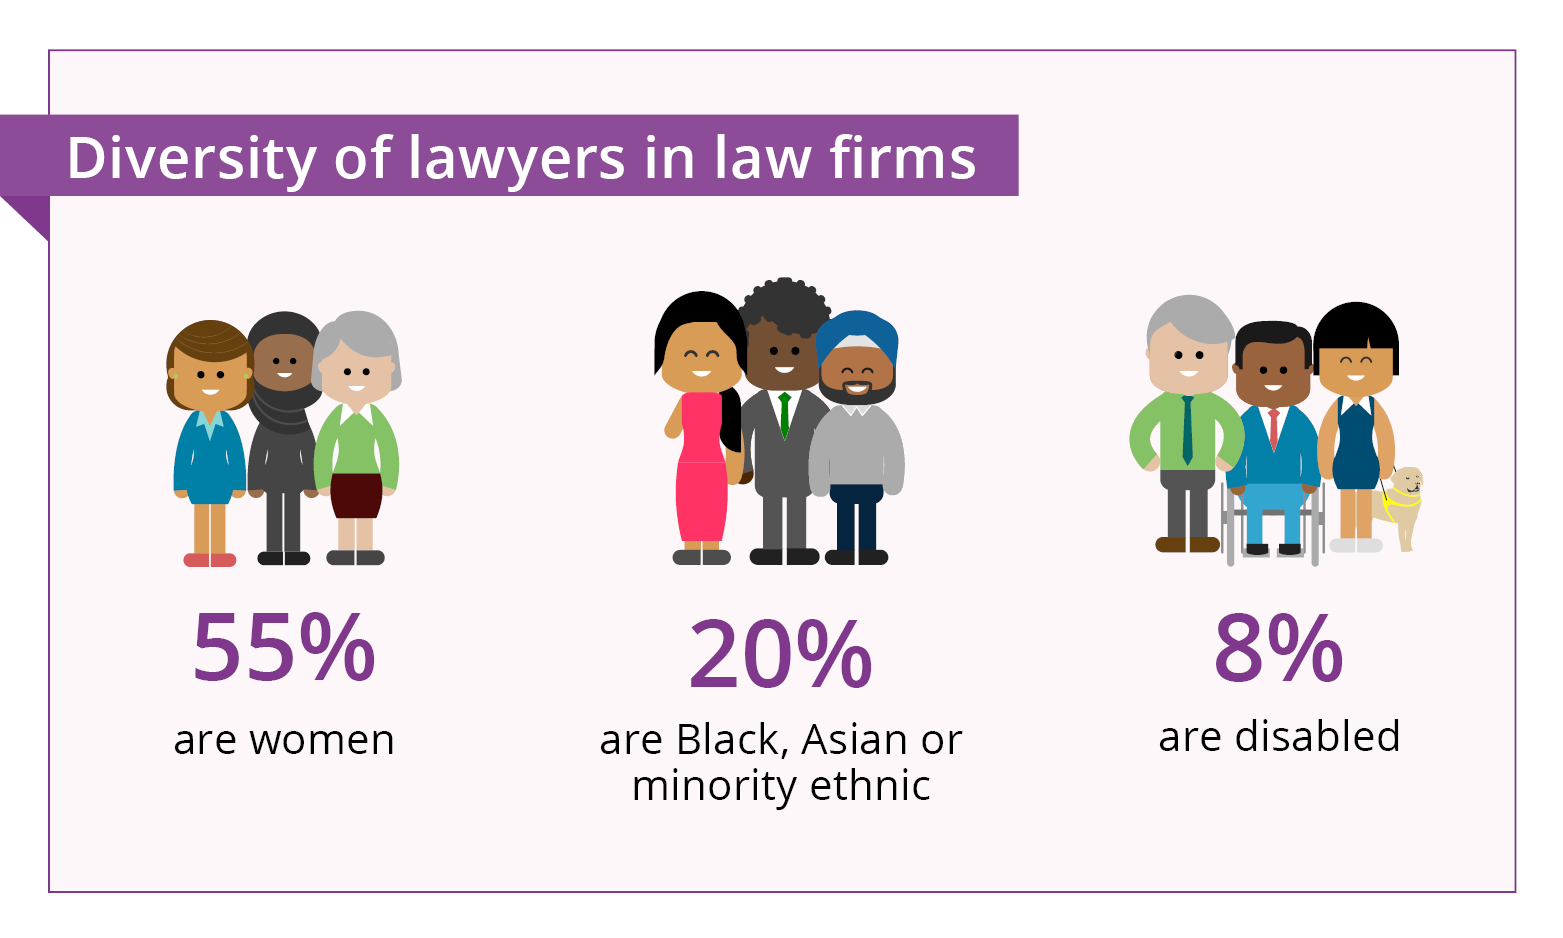
- 55% of lawyers were women, 43% were men and 2% preferred not to say.
- There was a seniority gap for women:
- 35% of full-equity partners (the most senior levels in law firms) were women
- 49% of salaried partners were women
- 63% of solicitors were women.
- The seniority gap was biggest in the largest (50+ partner) firms, where only 31% of full-equity partners were women.
- In 2015, 48% of lawyers were women, and 32% of partners were women, rising to 55% and 40% respectively in 2025.
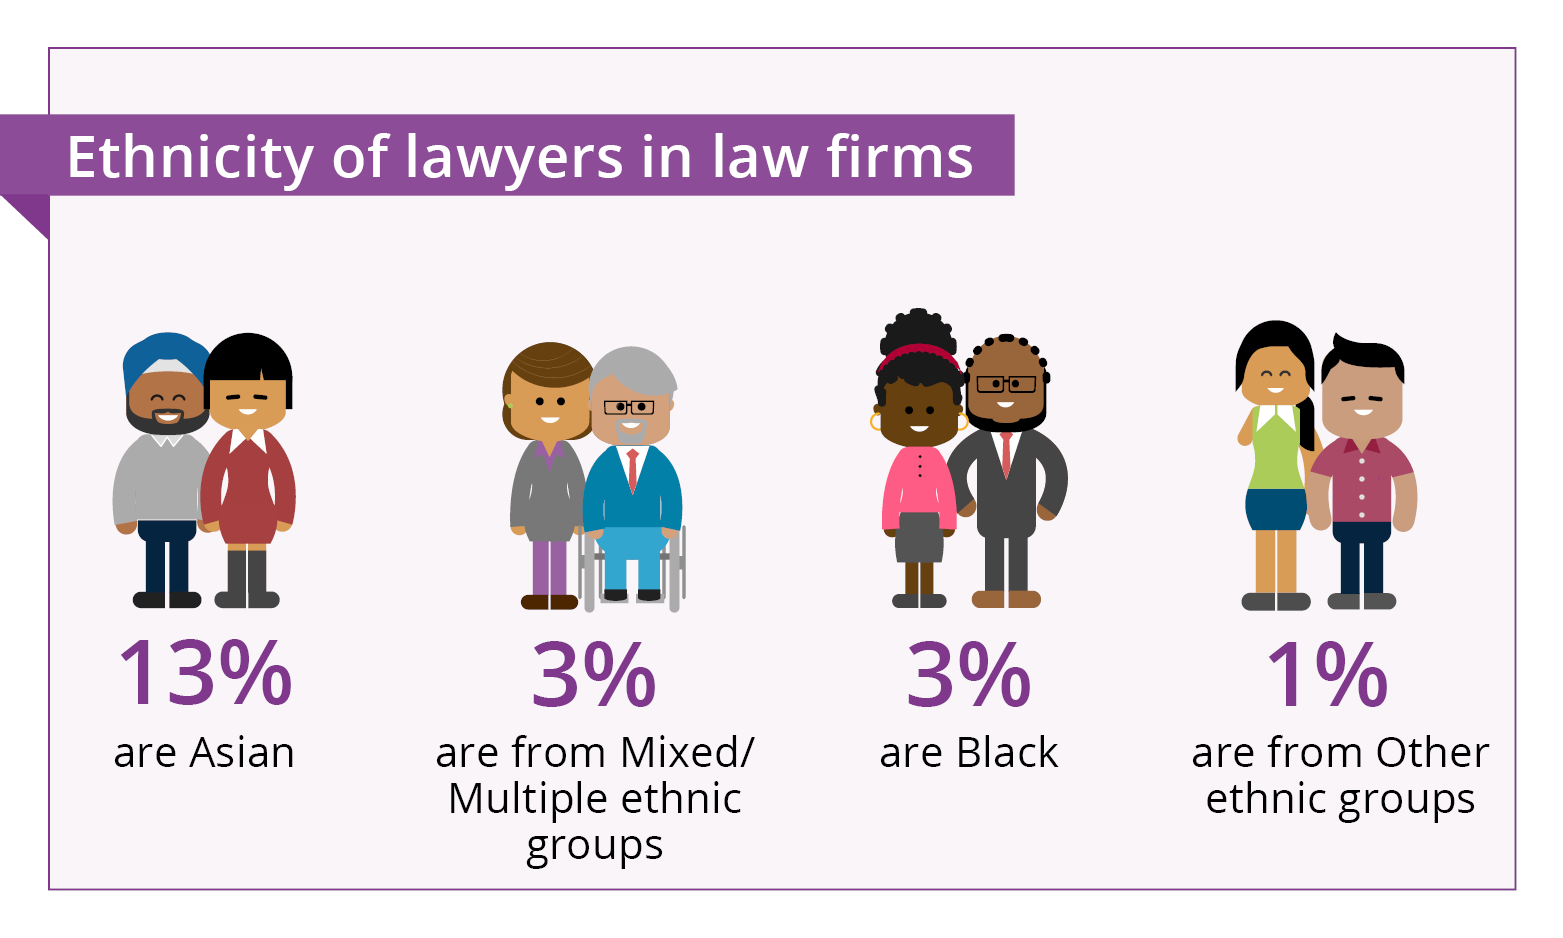
Ethnicity
- Ethnicity for all lawyers broke down as:
- 13% Asian
- 3% Black
- 3% Mixed/Multiple
- 1% from Other ethnic groups
- 76% White
- 4% prefer not to say.
- There was a higher proportion of lawyers from a Black, Asian and minority ethnic background working in one-partner firms (42%) than any other firm size.
- Overall, 19% of partners were from a Black, Asian or minority ethnic background, but in the largest (50+ partner) firms this was only 9%.
- Compared with their respective proportions within the UK workforce in 2025, the proportion of Black lawyers was lower and the proportion of Asian lawyers was higher.
- Since 2015, the proportion of Black, Asian and minority ethnic lawyers has increased by six percentage points, from 14% to 20% in 2025.
Disability
- 8% of lawyers declared they had a disability and 5% preferred not to say.
- 9% of partners declared they had a disability compared with 8% of solicitors.
- 13% of lawyers declared a disability in the smallest (one-partner) firms compared with 6% in the largest (50+ partner) firms.
- Disabled lawyers made up 8% of lawyers, compared with 17% of the UK workforce in 2025.
- Since 2015, the proportion of disabled lawyers has increased by five percentage points, from 3% to 8% in 2025.
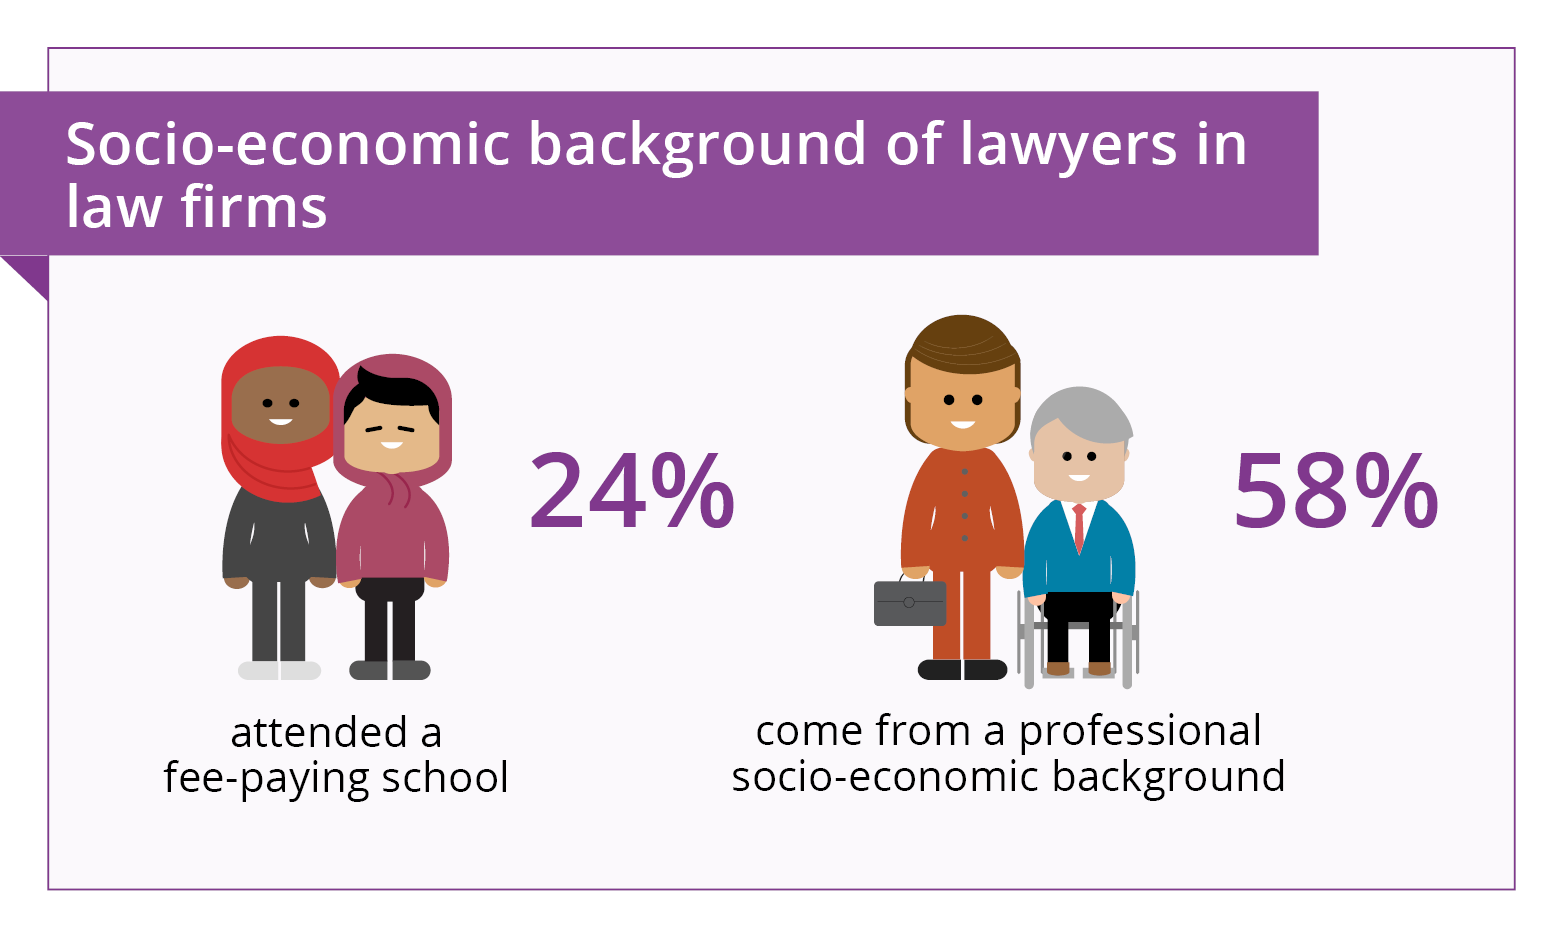
Socio-economic background
We report on socio-economic background using parental occupation (split into three categories: professional, intermediate and lower) and school attended (independent/ fee-paying school, state school or educated outside of the UK).
- 58% of lawyers were from a professional background, 13% from an intermediate background and 17% from a lower socio-economic background. 3% chose other responses and 10% preferred not to say their background.
- 20% of lawyers attended an independent/ fee-paying school, 63% attended a state school, 10% attended schools outside the UK and 7% preferred not to say their school type.
- A higher proportion of partners attended an independent/ fee-paying school (23%) than solicitors (18%).
- 63% of lawyers in the largest (50+ partner) firms were from a professional background compared with 54% in the smallest (one-partner) firms.
- Compared with national data from 2024 and using only known data, 66% of lawyers were from a professional background compared with 46% nationally. And 24% of the known population of lawyers attended an independent/fee-paying school, compared with 6% of all students in England in 2024/25.
Age
Age across all lawyers broke down as:
- 0.6% aged 16–24
- 30% aged 25–34
- 28% aged 35–44
- 22% aged 45–54
- 13% aged 55–64
- 4% aged 65+
- 2% preferred not to say.
The data across seniority for age reflects the average career pattern of solicitors and what age solicitors commonly become partners in a firm.
Generally, there was a higher proportion of lawyers from the younger age groups in the larger firms, and vice versa for the older age groups in the smaller firms.
Religion
The largest group of lawyers were Christian, followed by those who have no religion or belief. The overall breakdown was:
- 38% - Christian
- 37% - No religion or belief
- 6% - Muslim
- 3% - Hindu
- 2% - Jewish
- 2% - Sikh
- 0.5% - Buddhist
- 2% - Any other religion or belief
- 9% - Preferred not to say
Caring responsibilities
- 34% of lawyers had caring responsibilities for children, 8% had unpaid caring responsibilities for others with long-term physical or mental ill health.
- 5% preferred not to say whether they had childcare responsibility, 6% preferred not to say whether they had other care responsibilities.
- A higher proportion of partners had both types of caring responsibilities than solicitors.
Sexual orientation
- 4.5% of lawyers declared they were lesbian, gay, bi or preferred another description in 2025, 88.3% declared that they were heterosexual and 7.2% preferred not to say.
- There was a higher proportion of solicitors who identified as lesbian, gay or bi (4.8%) than partners (3.0%).
- There was a higher proportion of lawyers who identified as lesbian, gay or bi in the largest law firms and this decreased with firm size.
Gender identity
- 0.6% of lawyers answered that their gender identity was different to their sex at birth.
- There was a higher proportion of solicitors who have a gender identity different to their sex registered at birth (0.7%) than partners (0.4%). This proportion (0.4%) was the same for both full-equity and salaried partners.
About the data
We collect diversity data from the law firms we regulate in England and Wales every two years. Our most recent collection was in summer 2025, when 99.5% of law firms reported their data, covering more than 225,000 people working in 8,876 firms.
Firms collect the data from their staff in line with a standard set of diversity questions and report the aggregated data to us by role category. We collect the data using 13 different categories, which we have combined into broader groups in the data tools and for this analysis.
These groups are:
- 'all lawyers' and 'other staff' – 'other staff' refers to staff who are not authorised persons working in a firm, for example those working in roles supporting fee-earners or in corporate services roles
- full-equity solicitor partners ('full-equity partner'), salaried or partial-equity solicitor partners ('salaried partners') and 'solicitors'. Other authorised lawyers working in law firms (such as chartered legal executives and barristers) are counted in the 'solicitor' group.
How we show the data findings
In this report, we have set out the key findings for all the diversity characteristics covered in the questionnaire. It includes an analysis of the data by seniority, firm size and the main area of law undertaken by the firm. 'Main area of law' is taken from information firms give us when they renew their practicing certificates and is where they obtain most of their turnover from.
The report also includes an analysis of the data by firm location, comparing English law firms with Welsh law firms. For this analysis, Welsh firms are defined as those with their head office in Wales and English firms are those with their head office in England. Differences in diversity between English and Welsh law firms are likely to be influenced by the differences in the national populations.
We generally give percentages in this report rounded to whole numbers, except where a value is less than 1%. In the sexual orientation and gender identity sections, because of small numbers, we round to one decimal place. Due to rounding, some percentages will not add up to 100.
Data trends and comparisons
Where changes over time are notable, we compare the 2025 findings to the earliest year we collected this data. For most characteristics this is 2015.
For others it was later, for example, we started collecting socio-economic background data from 2019, and partner data split by full-equity partners and salaried partners from 2023.
We have also sourced the national comparison data from the Office for National Statistics (ONS), the Social Mobility Commission and the Department of Education. Where possible, we have used the most recent UK workforce data. However, this also includes data from Scotland and Northern Ireland. Where there is no recent workforce data, we have used the 2021 Census data for England and Wales.
For socio-economic background by parental occupation, we have used the most recent data from the Social Mobility Commission from 2024. And for school attended we have used the most recent figures on school type for England for 2024/25 from the Department of Education. There are no UK-wide or England and Wales combined figures for school type.
We include the 'prefer not to say' responses in our data tool when working out the percentages. National datasets are usually based on known data. When comparing our data to national datasets that use known data, we have recalculated the percentages to exclude the 'prefer not to say' responses. This allows a like-for-like comparison between national datasets and the law firm data.
Open all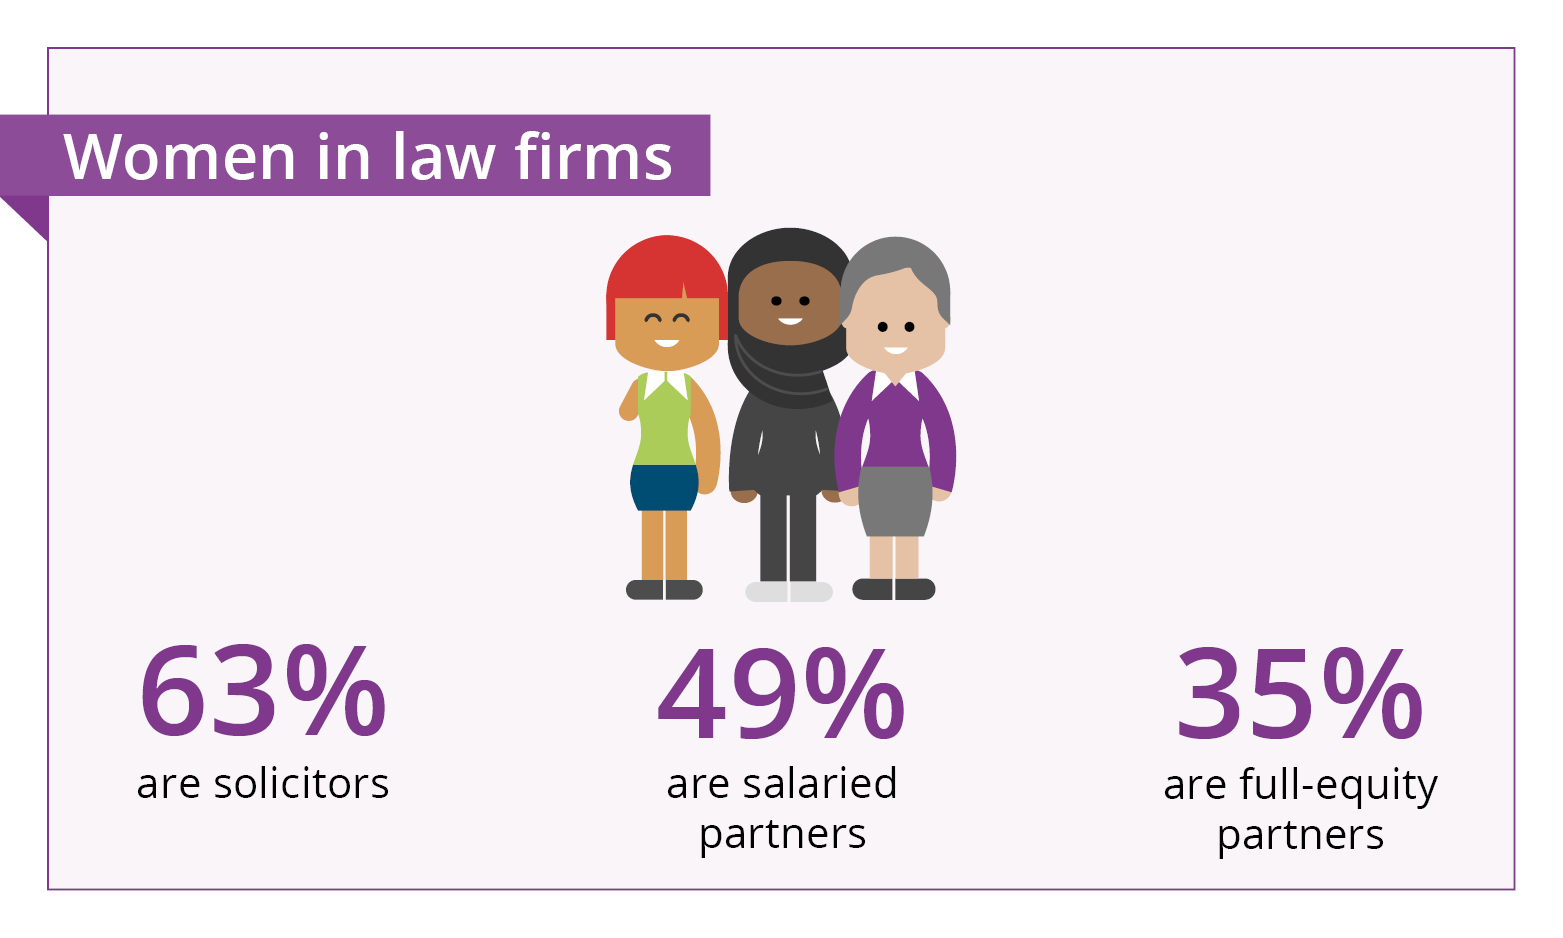 We made a change to the sex question this year to align with the Supreme Court ruling in April 2025 on the definition of sex. This means the response options were 'male', 'female' or 'prefer not to say'. The impact of this change on trends are likely to be minimal as last time we collected this data, 0.1% of lawyers chose the previously available option of 'other preferred description'.
All lawyers
The proportion of women lawyers in law firms was higher than the proportion of lawyers who were men in 2025. This has been true for a number of years but has continued to rise:
- 55% of lawyers were women, up from 48% in 2015
- 43% of lawyers were men, down from 50% in 2015
- 2% of lawyers preferred not to say, no change since 2015.
The ONS employment figures for 2025 show that women made up 49% of the UK workforce. In comparison, excluding the 'prefer not to say' responses, women made up 56% of the known population of lawyers.
By seniority
Women are less well represented at senior levels in law firms:
- 35% of full-equity partners were women, up from 32% in 2023
- 49% of salaried partners were women, up from 47% in 2023
- 63% of solicitors were women, up from 62% in 2023.
Looking at the trends over time for all partners, the proportion of women at partner level was 40%, up from 37% in 2023. This has risen consistently since 2015, when it was 32%.
By firm size
Compared with the proportion overall, there was a higher proportion of women lawyers in mid-size firms in 2025 (those with between 6–50 partners) and a lower proportion in one-partner firms.
| Firm size | Women lawyers (2015 comparison) | Women partners | Women full-equity partners | Women salaried partners |
|---|---|---|---|---|
| Across all firms | 55% (48%) | 40% | 35% | 49% |
| One-partner | 45% (43%) | 38% | 37% | 42% |
| 2–5 partners | 53% (46%) | 41% | 37% | 50% |
| 6–9 partners | 61% (51%) | 48% | 41% | 54% |
| 10–50 partners | 59% (52%) | 45% | 37% | 53% |
| 50+ partners | 55% (49%) | 37% | 31% | 45% |
Overall, 40% of partners in law firms were women. But there were differences by firm size, as shown in the table above.
By area of law
Overall, 55% of lawyers were women, but this varied by the main area of law undertaken by the firm. Firms whose main area of law was criminal or corporate law both had a lower proportion of women lawyers, at 40% and 47% respectively. In contrast, firms whose main area of law was private client law had a higher proportion of women lawyers, at 58%.
Other staff
There was a higher proportion of women working in other staff roles in law firms compared with men:
- 73% of other staff were women
- 25% of other staff were men.
Welsh firms compared with English firms
There was a higher proportion of women lawyers and women partners in Welsh firms compared with English firms:
- 61% of all lawyers in Welsh firms were women, compared with 55% in English firms
- 50% of partners in Welsh firms were women, compared with 40% in English firms.
The proportions of women lawyers and women partners in Welsh firms have increased more over time than in English firms:
- The proportion of women lawyers in both English and Welsh firms, was 48% in 2015, rising to 61% in Welsh firms and 55% in English firms by 2025.
- The proportion of women partners in Welsh firms has increased by 17 percentage points since 2015 (33% to 50%) compared with an increase of 8 percentage points in English firms (32% to 40%).
The proportion of full-equity women partners in Welsh firms (46%) was higher than in English firms (35%). As was the proportion of salaried women partners in Welsh firms (61%) compared with English firms (49%).
There was a higher proportion of other staff in Welsh firms who were women (78%) compared with English firms (73%).
We have provided the data broken down by the five main ethnicity categories: Black, Asian, Mixed/Multiple, Other and White, in line with categories used by the ONS.
We have also drawn comparisons between those making up the White group and those making up the Black, Asian, Mixed/Multiple and Other groups, which we refer to as the Black, Asian and minority ethnic group.
All lawyers
There has been an increase in the proportion of lawyers from a Black, Asian or minority ethnic background working in law firms. This has been rising steadily since 2015, from 14% to 20% in 2025. There has been a decrease in the proportion of White lawyers over the same period, from 80% to 76%.
The ethnicity breakdown of lawyers across all law firms in 2025 was:
- 13% Asian
- 3% Black
- 3% Multiple/Mixed
- 1% from Other ethnic groups
- 76% White
- 4% of lawyers preferred not to declare their ethnicity.
The employment figures from 2025 showed that 18% of the UK workforce were from Black, Asian or minority ethnic backgrounds (7% Asian, 5% Black, 2% Mixed/Multiple and 4% Other) and 82% were White.
In comparison, excluding the 'prefer not to say' responses, Black, Asian and minority ethnic groups made up 21% of the known population of lawyers (14% Asian, 3% Black, 3% Mixed/Multiple and 2% Other) and 79% were White.
By seniority
There was a difference by seniority for lawyers from a Black, Asian or minority ethnic background, with a higher proportion of full-equity partners from these groups compared with salaried partners. This is likely to be related to the higher proportion of solicitors in these groups who are sole practitioners (see the data about one-partner firms by ethnicity in the section below):
- 21% of full-equity partners
- 14% of salaried partners
- 21% of solicitors
Looking separately at the groups making up the Black, Asian and minority ethnic group:
Asian
- 15% of full-equity partners
- 10% of salaried partners
- 13% of solicitors.
Black
- 3% of full-equity partners
- 2% of salaried partners
- 3% of solicitors.
Mixed/Multiple ethnic backgrounds
- 2% of full-equity partners
- 2% of salaried partners
- 3% of solicitors.
Other ethnic groups
- 1% of full-equity partners
- 1% of salaried partners
- 2% of solicitors.
The pattern is different for partners in the White group, with a higher proportion of salaried partners from this group compared with full-equity partners:
- 73% of full-equity partners
- 82% of salaried partners
- 75% of solicitors.
Looking at trends over time for all partners, the proportion of Black, Asian and minority ethnic partners has increased by six percentage points since 2015, from 13% to 19%. This primarily reflects the increase in the proportion of Asian partners, which rose from 9% in 2015 to 13% in 2025.
The 'prefer not to say' response for partners was 5%, and 4% for solicitors.
By firm size
There was a higher proportion of lawyers from a Black, Asian or minority ethnic background working in one-partner firms (42%) in 2025 than any other firm size:
| Firm size | Lawyers from a Black, Asian or minority ethnic background (2015 comparison) | Partners from a Black, Asian or minority ethnic background | Full-equity partners from a Black, Asian or minority ethnic background | Salaried partners from a Black, Asian or minority ethnic background |
|---|---|---|---|---|
| Across all firms | 20% (14%) | 19% | 21% | 14% |
| One-partner | 42% (28%) | 42% | 42% | 41% |
| 2–5 partners | 25% (18%) | 24% | 25% | 21% |
| 6–9 partners | 15% (10%) | 11% | 11% | 11% |
| 10–50 partners | 15% (9%) | 10% | 9% | 10% |
| 50+ partners | 15% (11%) | 9% | 9% | 10% |
This difference was also reflected at partner level. Overall, 19% of partners were from a Black, Asian or minority ethnic background, but there were differences when we looked at the breakdown by firm size, as can be seen in the above table.
Since 2015, there has been an increase in the proportion of Black, Asian and minority ethnic partners in all firm sizes. But there is still a lower proportion of partners in the largest firms compared with the smaller firm sizes. For one-partner firms, the proportion of partners rose from 26% in 2015 to 42% in 2025, and in the 50+ partner firms from 6% to 9%.
Looking separately at the Black and Asian partners, in the largest firms with 50+ partners:
- 5% of full-equity partners and 5% of salaried partners were Asian
- 0.5% of full-equity partners and 0.6% of salaried partners were Black.
In the smallest firms with one partner:
- 30% of full-equity partners and 30% of salaried partners were Asian
- 9% of full-equity partners and 8% of salaried partners were Black.
By area of law
Overall, 20% of lawyers were from a Black, Asian or minority ethnic background, but this varied by the main area of law undertaken by the firm. Firms whose main area of law was criminal or private client law both had a higher proportion of Black, Asian and minority ethnic lawyers, at 33% and 37% respectively.
In contrast, firms whose main area of law was litigation law had a lower proportion of Black, Asian and minority ethnic lawyers, at 18%.
Other staff
The proportion of other staff working in law firms from a Black, Asian or minority ethnic background was 19%. This has increased from 12% in 2015. Looking at the groups making up the Black, Asian and minority ethnic group:
- 11% of other staff were Asian – up from 7% in 2015
- 4% of other staff were Black – up from 2% in 2015
- 3% of other staff were from a Mixed/Multiple ethnic background – up from 2% in 2015
- 1% of other staff were from Other ethnic groups – with a less than 1 percentage point increase since 2015.
Welsh firms compared with English firms
There was a lower proportion of Black, Asian and minority ethnic lawyers in Welsh firms compared with English firms:
- 6% of lawyers were from a Black, Asian or minority ethnic background in Welsh firms
- 4% were Asian
- 0.5% were Black
- 2% were Multiple/Mixed
- 0.2% were from Other ethnic groups.
- 21% of lawyers were from a Black, Asian or minority ethnic background in English firms
- 13% were Asian
- 3% were Black
- 3% were Multiple/Mixed
- 1% were from Other ethnic groups.
The proportion of Black, Asian and minority ethnic full-equity partners was lower than salaried partners in Welsh firms, whereas the opposite was true in English firms:
- The proportion full-equity partners in Welsh firms was 4% compared with 22% in English firms.
- The proportion of salaried partners in Welsh firms was 5% compared with 15% in English firms.
The proportion of Black, Asian and minority ethnic partners in Welsh firms has increased by two percentage points since 2015 (2% to 4%). This compared with an increase of six percentage points in English firms (13% to 19%).
For other staff in Welsh firms, there was a lower proportion of those from a Black, Asian or minority ethnic background (8%) compared with English firms (20%).
 This section covers two questions – whether a person has a disability and whether their day-to-day activities are limited by a health condition or disability.
All lawyers
There has been an increase in the proportion of lawyers who declared a disability and in the proportion of those whose day-to-day activities were limited by a health condition or disability:
- 8% of lawyers declared a disability, up from 3% since 2015
- 7% of lawyers declared that their day-to-day activities were limited by a health condition or disability (up from 4% since 2015). In 2025, 2% said they were affected a lot and 5% said they were affected a little
- 5% of lawyers preferred not to say whether they had a disability and 7% preferred not to say whether their day-to-day activities were limited by a health condition or disability.
There remains a considerable difference for disability compared with the wider population. In 2025, 17% of the UK workforce declared a disability. In comparison, excluding the 'prefer not to say' responses, disabled lawyers made up 8% of the known population of lawyers.
By seniority
There were some differences by seniority. Overall, 9% of partners declared a disability, compared with 8% of solicitors. A higher proportion of full-equity partners declared a disability than salaried partners (please note the percentages may not add up to given totals due to rounding):
- 10% of full-equity partners declared a disability and 7% declared that their day-to-day activities were limited by a health condition or disability (3% were affected a lot and 4% a little)
- 6% of salaried partners declared a disability and 6% declared that their day-to-day activities were limited by a health condition or disability (1% were affected a lot and 5% a little)
- 8% of solicitors declared a disability and 7% declared that their day-to-day activities were limited by a health condition or disability (1% were affected a lot and 5% a little).
Looking at the trends over time for partners:
- 9% of partners declared a disability – up from 3% in 2015
- 7% of partners declared that their day-to-day activities were limited by a health condition or disability – 2% were affected a lot and 5% a little.
Only 5% of partners preferred not to say whether they had a disability, and 7% preferred not to say whether their day-to-day activities were limited by a health condition or disability. This was the same for solicitors.
In 2023, 5% of partners declared a disability. The increase from 5% to 9% in 2025 is a larger increase than we normally see over two years. While this is only a four-percentage point increase, because of the smaller percentages involved, this is almost double the number of partners declaring a disability in 2023.
By firm size
There was a higher proportion of disabled lawyers in the smaller firms compared with the larger firms:
- 13% of lawyers declared a disability in one-partner firms (up from 3% in 2015) and 10% in the 2–5 partner firms (up from 3% in 2015).
- 6% of lawyers declared a disability in the 6–9 partner and the 50+ partner firms, with 7% of lawyers in the 10–50 partner firms. This was up by four percentage points for the 10–50 partner firms and the 50+ partner firms and two percentage points for the 6–9 partner firms since 2015.
Similar differences were reflected in lawyers whose activities were limited by a health condition or disability.
By area of law
Overall, 8% of lawyers declared a disability but there were some differences by the main area of law undertaken by the firm. The proportion of disabled lawyers was lower in law firms mainly carrying out some areas of law than overall. For example, 6% of lawyers in firms whose main work area was corporate law.
And the proportion of disabled lawyers was higher in firms mainly carrying out other areas of law than overall, including:
- criminal law where 13% of lawyers declared a disability
- private client law where 11% of lawyers declared a disability.
Other staff
For other staff working in law firms:
- 9% declared a disability
- 8% declared that their day-to day activities were limited by a health condition or disability, with 2% affected a lot and 6% a little.
Welsh firms compared with English firms
In both English and Welsh firms, the proportion of lawyers who declared a disability was 8%. There was no difference in the disclosure rates of disability between English and Welsh firms – 5% preferred not to say in both countries. The proportion of lawyers whose day-to-day activities were limited by a health condition or disability was higher in English firms (7%) than in Welsh firms (5%).
Overall, there was little difference between Welsh and English firms for disability and whether day-to-day activities were limited across seniority levels or for other staff.
 We have focused on parental occupation and school type in this analysis. According to the Social Mobility Commission, parental occupation is the most reliable indicator of social mobility. Data for parental qualification is available in the firm diversity data tool.
Parental occupations have been grouped into three categories to indicate socio-economic background:
- professional (higher) socio-economic category is made up of modern and traditional professional occupations and senior, middle or junior managers or administrators
- intermediate socio-economic category is made up of clerical and intermediate occupations and small business owners who employ fewer than 25 people
- lower socio-economic (working class) category is made up of technical and craft occupations and long-term unemployed.
All lawyers
Parental occupation
Since we started collecting this data in 2019, there has been some change in the breakdown of the profession by socio-economic background. This primarily relates to an increase in lawyers from an intermediate background and decreases in those from both professional and lower socio-economic backgrounds:
- professional background – 58% of lawyers, down from 60% in 2019
- intermediate background – 13% of lawyers, up from 5% in 2019
- lower socio-economic background – 17% of lawyers, down from 21% in 2019
- other responses (such as 'I don't know' or 'retired') – 3% of lawyers, no change since 2019
- prefer not to say – 10% of lawyers, down from 11% in 2019.
Excluding the prefer not to say and other responses, lawyers compared with the latest general population proportions from 2024 as follows:
- professional background – 66% of lawyers compared with 46% nationally
- intermediate background – 14% of lawyers compared with 20% nationally
- lower socio-economic background – 19% of lawyers compared with 34% nationally.
School attended
There was a decrease in the proportion of lawyers attending an independent/fee-paying school (down from 23% in 2015 to 20% in 2025). And there was an increase in the proportion of lawyers who attended a school outside the UK (up from 8% in 2015 to 10% in 2025). In 2025:
- 20% of lawyers attended an independent/fee-paying school
- 16% had no bursary
- 4% received a bursary covering 90% or more of the fees
- 63% of lawyers attended a state school
- 20% attended selective schools
- 43% attended non-selective schools
- 10% attended schools outside the UK
- 7% of lawyers preferred not to declare their school type.
Excluding the 'prefer not to say' and the 'attended schools outside of the UK' responses, 24% of lawyers attended an independent/fee-paying school, compared with 6% of all students in England in 2024/25.
By seniority
Parental occupation
There was a higher proportion of solicitors from a lower socio-economic background (18%) than partners (15%). Otherwise, there were no notable differences by seniority for parental occupation.
School attended
A higher proportion of partners attended an independent/fee-paying school (23%) compared with solicitors (18%). And a higher proportion of solicitors attended school outside the UK (11%) than partners (8%).
There were also some differences between full-equity and salaried partners in school attended:
| School attended | Full-equity partners | Salaried partners | Solicitors |
|---|---|---|---|
| State school | 59% | 65% | 64% |
| Independent/ fee-paying school | 23% | 22% | 18% |
| Attended school outside the UK | 9% | 6% | 11% |
| Preferred not to say | 9% | 6% | 6% |
By firm size
Parental occupation
There was a higher proportion of lawyers from a professional background in larger firms. There was a higher proportion of lawyers from an intermediate or lower socio-economic background in mid-sized law firms:
- 63% of lawyers in firms with 50+ partners were from a professional background (down from 73% in 2019) compared with 54% in one-partner firms (up from 47% in 2019)
- 6–9 partner firms had the highest proportion of lawyers from an intermediate or lower socio-economic background (15% and 21% respectively)
- 50+ partner firms had the lowest proportion of lawyers from an intermediate background (10%) and shared the lowest proportion of lawyers from a lower socio-economic background with one-partner firms; both 14%.
There was a higher proportion of lawyers in one-partner firms (17%) who preferred not to declare their parental occupation, compared with 8% in 50+ partner firms.
School attended
There was a higher proportion of lawyers who attended an independent/fee-paying school in larger firms compared with smaller firms. This proportion decreased as firm size decreased. The relationship between firm size and attending state school or attending school outside the UK was not as linear. In 2025:
- 26% of lawyers in firms with 50+ partners attended an independent/fee-paying school, compared with 13% in one-partner firms
- 6–9 partner firms had the highest proportion of lawyers who attended a state school at 71%, and 50+ partner firms had the lowest proportion of lawyers who attended a state school at 57%
- 14% of lawyers in firms with one partner and 12% of lawyers in firms with 50+ partners attended school outside the UK, compared with 6% in 6–9 partner firms.
A lower proportion of lawyers in firms with 50+ partners preferred not to declare their school type (4%), compared with 14% of lawyers in one-partner firms.
By area of law
Parental occupation
There were some differences in socio-economic background by main area of law undertaken by firms. Looking at the biggest differences:
- 69% of lawyers in firms whose main area of law was corporate law were from a professional background, compared with 49% in firms whose main area was criminal law
- 19% of lawyers in firms whose main area of law was litigation or property law were from a lower socio-economic background, compared with 10% in firms whose main area of law was corporate law
- 19% of lawyers in firms whose main area of law was criminal law preferred not to declare their parental occupation, compared with 8% in firms whose main area of law was litigation or corporate law.
School attended
There were some differences in school attended by main area of law undertaken by the firm. Looking at the biggest differences:
- 30% of lawyers in firms whose main area of law was corporate law attended an independent/fee-paying school. This compared with 11% of lawyers whose main area of law was criminal law and 13% whose main area was private client law
- 70% of lawyers in firms whose main area of law was property law attended a state school, compared with 41% of lawyers whose main area was corporate law
- 24% of lawyers in firms whose main area of law was corporate law attended school outside the UK, compared with 4% of lawyers in firms whose main area was criminal law
- 5% of lawyers in firms whose main area of law was corporate law preferred not to declare their school type. This compared with 16% in firms whose main area was criminal law.
Other staff
Parental occupation
The breakdown for other staff working in law firms in 2025 was:
- professional background – 42% of other staff
- intermediate background – 14% of other staff
- lower socio-economic background – 29% of other staff
- other responses (such as 'I don't know' or 'retired') – 4% of other staff
- preferred not to say – 10% of other staff.
School attended
For other staff working in law firms:
- 7% attended an independent/fee-paying school
- 78% attended a state school
- 9% attended a school outside the UK
- 5% preferred not to declare their school type.
Welsh firms compared with English firms
Parental occupation
There was a lower proportion of lawyers working in Welsh firms from a professional background (51%) compared with lawyers working in English firms (58%). There was a higher proportion of lawyers working in Welsh firms from a lower socio-economic background (24%) compared with English firms (17%).
At partner level, there was a lower proportion of partners in Welsh firms from a professional background (53%) compared with English firms (60%). And a higher proportion of partners from a lower socio-economic background in Welsh firms (19%) compared with English firms (15%). These same patterns were seen across the solicitor and other staff populations.
School attended
There was a higher proportion of lawyers working in English firms who went to an independent/fee-paying school (20%) than in Welsh firms (8%). For lawyers working in Welsh firms, 85% went to a state school, compared with 63% in English firms, and only 2% working in Welsh firms attended school outside the UK (10% in English firms).
These proportions were also reflected at partner level, where in English firms a higher proportion of partners went to an independent/ fee-paying school (24%) than in Welsh firms (9%). And 81% of partners in Welsh firms went to a state school, compared with 61% in English firms. These same patterns were seen across the solicitor and other staff populations.
All lawyers
There has been little change in the age profile of lawyers since 2015, with more than half (58%) aged between 25 and 44. The proportion of lawyers in each age group broadly follows what we would expect to see, with a lower proportion of the youngest and oldest age groups compared with the national proportions. Given the qualification requirements we would not expect many people to qualify between 16–24, and we would expect people to begin to retire in the 65+ group.
The percentages have been given in the table below, and also recalculated without the prefer not to say values to compare with the general population from the Census in 2021 for England and Wales.
| Age range | Proportion of lawyers | Proportion of lawyers recalculated without prefer not to say | National proportions |
|---|---|---|---|
| 16–24 | 0.6% | 0.6% | 13% |
| 25–34 | 30% | 30% | 17% |
| 35–44 | 28% | 29% | 15% |
| 45–54 | 22% | 22% | 17% |
| 55–64 | 13% | 13% | 15% |
| 65+ | 4% | 4% | 23% |
| Preferred not to say | 2% | N/A | N/A |
By seniority
The data broadly reflects the age solicitors commonly become partners in a firm:
- for full-equity partners, the largest group was 45–54 (37%), followed by 55–64 (26%) and then 35–44 (22%)
- for salaried partners, the largest group was 35–44 (40%), followed by 45–54 (33%) and then 55-64 (17%)
- for solicitors, the largest age group was 25–34 (45%) followed by 35–44 (28%) and then 45–54 (14%).
By firm size
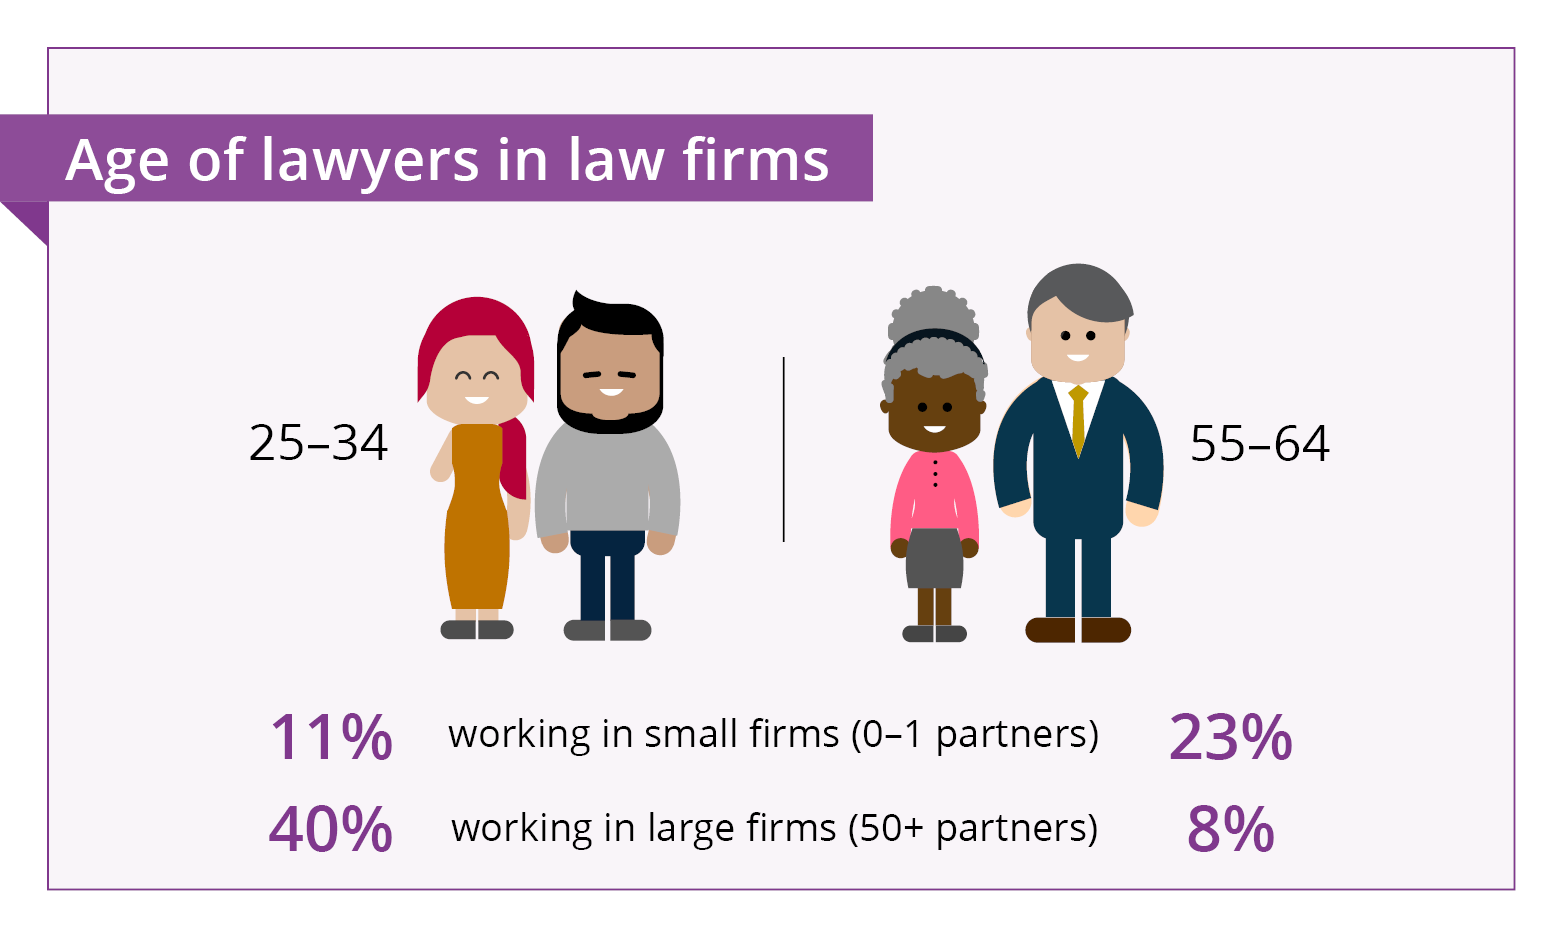
There were some differences in age groups by firm size, with a higher proportion of older lawyers in smaller firms. Looking at the 25-34 and 55-64 age groups by firm size:
- 40% of all lawyers in 50+ partner firms were aged 25–34 and 8% were aged 55–64
- 33% of all lawyers in 10–50 partner firms were aged 25–34 and 12% were aged 55–64
- 25% of all lawyers in 6–9 partner firms were aged 25–34 and 16% were aged 55–64
- 19% of all lawyers in 2–5 partner firms were aged 25–34 and 18% were aged 55–64
- 11% of all lawyers in one-partner firms were aged 25–34, 23% were aged 55–64.
By area of law
There were some differences in the age categories, depending on the main area of law undertaken by the firm:
- 48% of lawyers working in law firms whose main area of law was corporate law, were aged 25–34. This compared with 14% in firms whose main area of law was criminal law and 18% whose main area was private client law.
- 7% of lawyers working in law firms whose main area of law was corporate law were aged 55–64. This compared with 24% working in law firms whose main area was criminal law.
Other staff
For other staff working in law firms, the largest age group was 25–34 (29%) and this was true for all firm sizes and across all areas of law. The smallest age group was 65+ (3%), and this was also true for all firm sizes and across all areas of law.
Welsh firms compared with English firms
The highest proportion of lawyers in English firms were aged 25–34 (30%), followed by those aged 35-44 (28%). The highest proportion of lawyers in Welsh firms was tied between those aged 25–34 and those aged 35–44 (both 26%). The age breakdown across both countries was broadly similar, including by seniority and for other staff, save for these differences:
- there was a higher proportion of full-equity partners in English firms aged 45-54 (38%) than in Welsh firms (28%)
- there was a higher proportion of full-equity partners in Welsh firms aged 65+ (14%) than in English firms (8%).

All lawyers
There has been some change in the breakdown of lawyers by religion since 2015. This primarily relates to a decrease in the proportion of Christian lawyers (38% from 48% in 2015) and an increase in those with no religion or belief (37% from 27% in 2015).
The largest group of lawyers in 2025 were Christian, followed by those who had no religion or belief. The largest of the other faith groups were Muslim. In the table below we have provided the national proportions for religion in England and Wales from the 2021 Census for comparison:
| Religion or belief | Proportion of lawyers | National proportions |
|---|---|---|
| Christian | 38% | 46% |
| No religion or belief | 37% | 37% |
| Muslim | 6% | 6% |
| Hindu | 3% | 2% |
| Jewish | 2% | 0.5% |
| Sikh | 2% | 0.9% |
| Buddhist | 0.5% | 0.5% |
| Any other religion or belief | 2% | 0.6% |
| Prefer not to say | 9% | 6% |
By seniority
There were some differences by seniority for the three largest groups (Christian, no religion or belief and Muslim):
- 43% of full-equity partners, 45% of salaried partners and 35% of solicitors were Christian
- 28% of full-equity partners, 35% of salaried partners and 41% of solicitors had no religion or belief
- 8% of full-equity partners, 5% of salaried partners and 6% of solicitors were Muslim.
Looking at trends over time for all partners, there have been some changes since 2015, including:
- a decrease in the proportion of Christian partners from 50% in 2015 to 44% in 2025
- an increase in the proportion of partners with no religion or belief from 22% in 2015 to 30% in 2025
- an increase in the proportion of Muslim partners from 4% in 2015 to 7% in 2025.
By firm size
There were some differences by firm size for the three largest groups, with a higher proportion of Christians and those with no religion or belief in the largest firms compared with the smallest firms. The opposite was true for Muslims.
Key findings included:
- 33% of lawyers in one-partner firms were Christian compared with 39% in firms with 50+ partners
- 21% of lawyers in one-partner firms had no religion or belief compared with 42% in firms with 50+ partners
- 19% of lawyers in one-partner firms were Muslim, compared with 2% of lawyers in firms with 50+ partners.
And 15% of lawyers in one-partner firms preferred not to declare their religion, compared with 8% in the firms with 50+ partners.
By area of law
There were some differences by main area of law undertaken by the firm. The biggest differences were apparent when looking at lawyers in the three largest groups: Christians, no religion or belief and Muslims.
Key findings included:
- In firms whose main area of law was corporate law, 35% of lawyers were Christian, 41% of no religion or belief and 3% Muslim.
- In firms whose main area of law was criminal law, 31% of lawyers were Christian, 28% of no religion or belief and 15% Muslim.
- In firms whose main area of law was private client law, 37% of lawyers were Christian, 26% of no religion or belief and 16% Muslim.
Other staff
For other staff working in law firms, the breakdown was as follows:
- 43% - no religion or belief
- 36% - Christian
- 6% - Muslim
- 3% - other religion or belief
- 2% - Hindu
- 1% - Sikh
- 0.5% - Buddhist
- 0.6% - Jewish
- 8% - prefer not to say.
Welsh firms compared with English firms
The largest religious group among lawyers in both English and Welsh firms was Christian, 38% for English firms and 45% for Welsh firms. The next largest group were lawyers who had no religion or belief, 37% for English firms and 43% for Welsh firms.
Of lawyers in English firms, 7% were Muslim, 3% Hindu, 2% Sikh and 2% Jewish. Of lawyers in Welsh firms, 2% were Muslim and the proportions of Hindu, Sikh and Jewish lawyers were all less than 1% and rounded down to 0% of the lawyer population. Across seniority and other staff populations, these patterns remained broadly consistent across both countries.
All lawyers
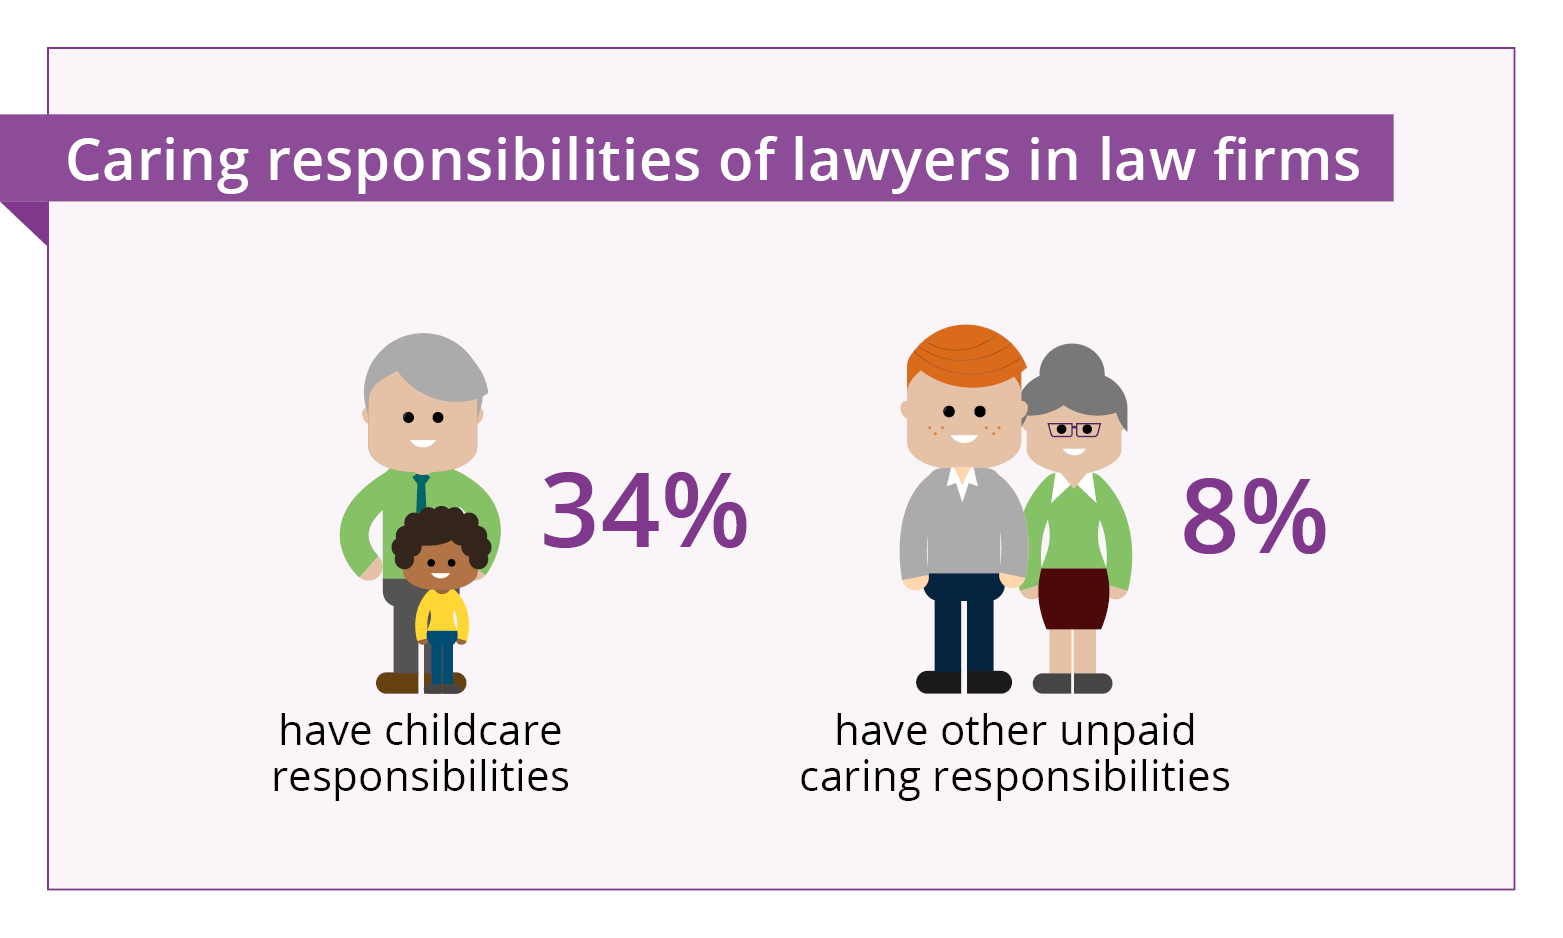
Over a third of lawyers were primary carers for a child or children under 18 (34%) and 8% had unpaid caring responsibilities for others with long-term physical or mental ill health. We refer to these categories as ‘childcare responsibilities’ and ‘other caring responsibilities’ for ease going forward.
The proportion of those who preferred not to say whether they had childcare responsibilities was 5%. The proportion of those who preferred not to say whether they had other caring responsibilities was 6%.
There are no nationally recognised statistics on childcare responsibilities. However, for other caring responsibilities, 10% of the population of England and Wales in the 2021 Census declared they had other caring responsibilities. Excluding the ‘prefer not to say’ responses, 8% of lawyers had other caring responsibilities.
By seniority
The proportion of those who had both types of caring responsibilities was higher for full-equity partners and salaried partners than solicitors.
Key findings included:
- 38% of full-equity partners, 49% of salaried partners and 29% of solicitors had childcare responsibilities.
- 7% of full-equity partners, 5% of salaried partners and 4% of solicitors preferred not to say whether they had childcare responsibilities.
- 9% of full-equity partners, 9% of salaried partners and 7% of solicitors had other caring responsibilities.
- 8% of full-equity partners, 6% of salaried partners and 5% of solicitors preferred not to say whether they had other caring responsibilities.
By firm size
There were no notable differences in the proportion of lawyers who had other caring responsibilities by firm size. For childcare responsibilities, a higher proportion of those in mid-sized law firms reported having childcare responsibilities than in the other firm sizes.
Key findings included:
- In 50+ partner firms, 32% of lawyers had childcare responsibilities and in one-partner firms, 31% had childcare responsibilities.
- Whereas in 10–50 partner and 6–9 partner firms, 36% of lawyers had childcare responsibilities.
By area of law
There were some differences when we look at lawyers by the main area of law undertaken by law firms. The biggest differences were:
- 38% of lawyers working in firms whose main area of law was litigation law had childcare responsibilities, compared with 29% of those in firms whose main area was criminal law and 25% of those in firms whose main area was corporate law.
- 4% of lawyers working in firms whose main area of law was corporate law had other caring responsibilities, compared with 7-8% in all other firms.
Other staff
For other staff working in law firms, 24% had childcare responsibilities and 8% had other caring responsibilities. 4% of other staff preferred not to say if they had childcare responsibilities, while 5% preferred not to say if they had other caring responsibilities.
Welsh firms compared with English firms
The breakdown of those working in English and Welsh firms was broadly similar.
- 36% of lawyers working in Welsh firms had childcare responsibilities compared with 34% in English firms
- 9% of lawyers working in Welsh firms had other caring responsibilities, compared with 8% in English firms
- For both countries, 5% preferred not to say if they had childcare responsibilities, while 6% preferred not to say whether they had other caring responsibilities.
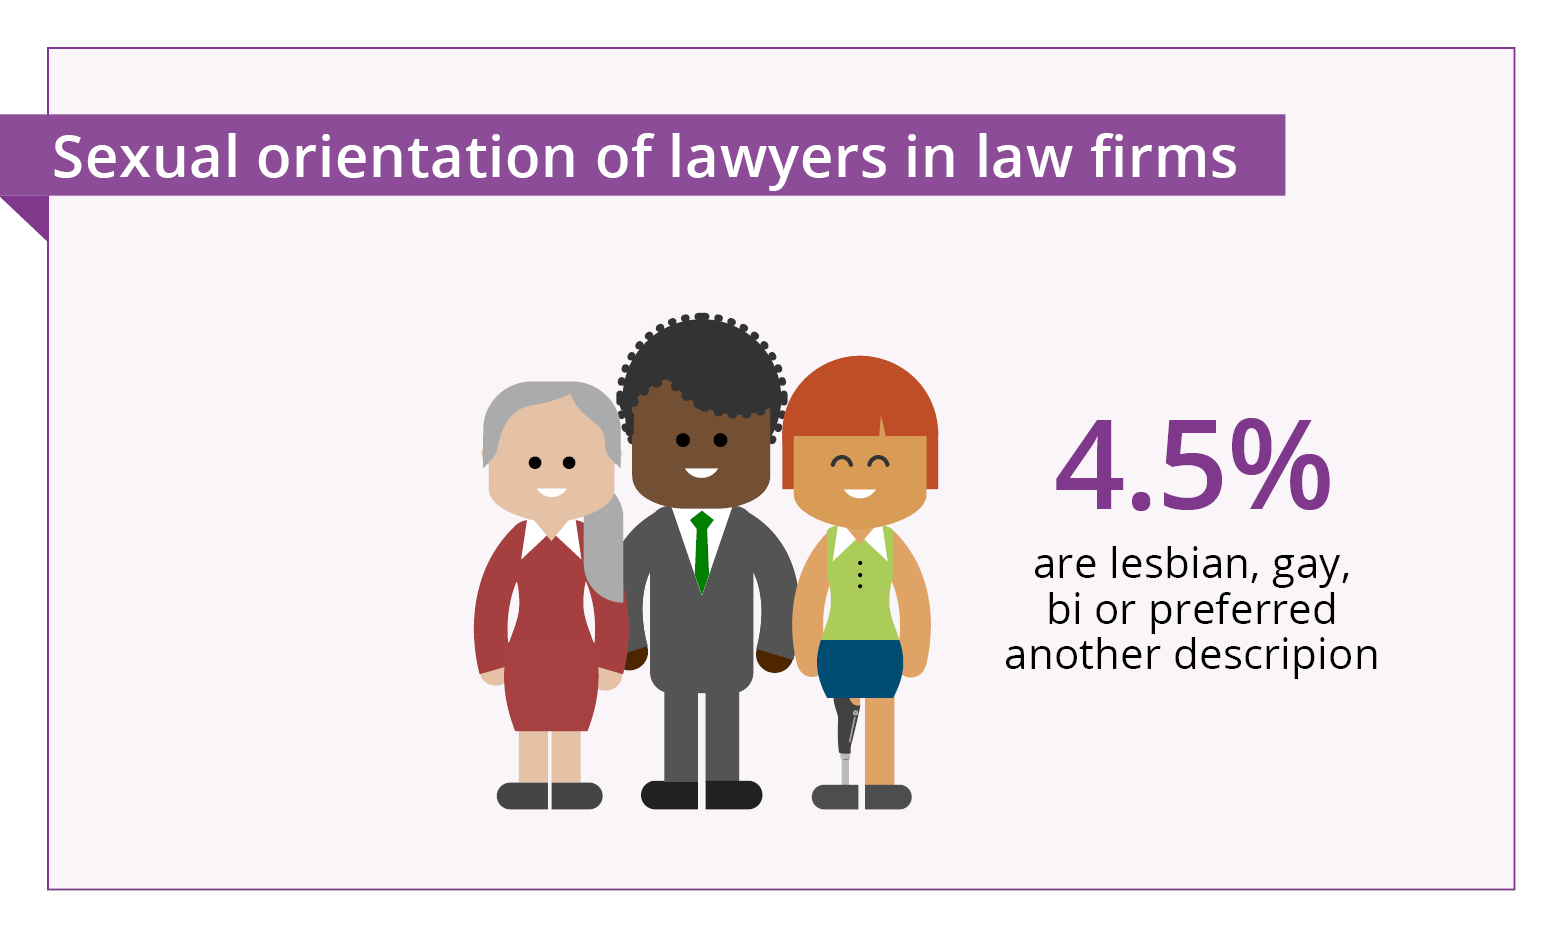
All lawyers
There was an increase in the proportion of lawyers who were lesbian, gay, bi (LGB) or preferred another description from 3.0% in 2015 to 4.5% in 2025. Because of the small numbers and to allow closer comparison with the latest national data from 2024, we have provided percentages rounded to one decimal point.
| Identify as | Proportion of lawyers in 2025 | Proportion of lawyers in 2015 | National proportions in 2024 |
|---|---|---|---|
| Heterosexual | 88.3% | 87.7% | 93.6% |
| Lesbian or gay | 2.6% | 2.1% | 2.1% |
| Bi | 1.6% | 0.6% | 1.6% |
| Other preferred description | 0.4% | 0.3% | 1.1% |
| Prefer not to say | 7.2% | 9.3% | 1.8% |
By seniority
There was a higher proportion of solicitors who were LGB than partners.
Key findings included:
- 4.8% of solicitors were LGB (2.0% bi, 2.8% lesbian or gay), compared with 3.0% of partners (0.7% bi, 2.3% lesbian or gay)
- a higher proportion of salaried partners were LGB (3.3%) than full-equity partners (2.9%)
- a higher proportion of full-equity partners preferred not to say (9.1%) than salaried partners (5.5%).
By firm size
Although the proportions were small, there were some variations when we looked at the data by firm size. There was a higher proportion of lawyers who were LGB in larger firms and this decreased with firm size:
- 5.2% of lawyers in 50+ partner firms were LGB
- 4.9% of lawyers in firms with 10–50 partners were LGB
- 3.7% of lawyers are in firms with 6–9 partners were LGB
- 3.0% of lawyers are in firms with 2–5 partners were LGB
- 2.4% of lawyers in firms with one-partner were LGB.
There was a higher proportion of lawyers who preferred not to say in the smallest firms (13.5% in one-partner firms), than the largest firms (6.0% in 50+ partner firms).
By area of law
There was some variation in the proportion of people who were LGB when we break down the data by main area of law undertaken by the firm. Looking at the biggest differences:
- 6.8% of lawyers were LGB in firms whose main area of law was corporate law
- 2.3% of lawyers were LGB in firms focusing on criminal law.
There were more lawyers working in firms focused on criminal law that chose 'preferred not to say' (12.3%) than those in firms whose main area was corporate law (8.5%).
Other staff
The proportion of other staff who were LGB was higher than the proportion of all lawyers who were LGB:
- 88.0% of other staff were heterosexual
- 5.3% of other staff were LGB
- 0.6% of other staff preferred another description
- 6.1% of other staff preferred not to say.
Welsh firms compared with English firms
There was a higher proportion of lawyers who were LGB in English firms (4.2%) than in Welsh firms (3.1%). This pattern was consistent across seniority. However, there was a higher proportion of other staff in Welsh firms who were LGB (6.4%) than in English firms (5.3%).
All lawyers
The proportion of lawyers who had a gender identity that was different from their sex registered at birth in 2025 was 0.6%. This has fallen by 1.8 percentage points from 2.4% in 2017 when we first started collecting this data. In 2025, 3.7% of lawyers preferred not to say.
This data was collected nationally for the first time in the 2021 census, where there was a 6% non-disclosure rate. Less than one per cent of the general population (0.5%) answered that their gender identity was different to their sex registered at birth. Please note the caveat in relation to this data on the ONS website.
By seniority
There was a higher proportion of solicitors who had a gender identity different to their sex registered at birth (0.7%) than partners (0.4%). This proportion (0.4%) was the same for both full-equity and salaried partners.
By firm size
Although the numbers are very small, there are some differences by firm size. Looking at the biggest differences:
- 1.1% of lawyers in one-partner firms had a gender identity different from their sex registered at birth (down from 1.5% in 2017)
- 0.4% of lawyers in firms with 10–50 partners had a gender identity different from their sex registered at birth (down from 3.3% in 2017)
- 6.3% of lawyers in one-partner firms preferred not to say, compared with 3.8% in firms with 50+ partners.
By area of law
There were small variations when we looked at the main areas of law undertaken by the firm. Looking at the biggest differences:
- 1.1% of lawyers working in firms whose main area of law was litigation law had a gender identity different from their sex registered at birth
- 0.4% of lawyers working in firms whose main area of law was property law had a gender identity different from their sex registered at birth
- 6.2% of lawyers in firms whose main area of law was criminal law preferred not to say, compared with 2.9% of lawyers in firms whose main area was litigation law.
Other staff
For other staff working in law firms, 1.1% had a gender identity that was different from their sex registered at birth. However, in firms that mainly do criminal law only 0.4% of other staff had a gender identity that is different from their sex registered at birth. This compared with 2.0% in firms that mainly do litigation.
Welsh firms compared with English firms
There was a higher proportion of lawyers who had a gender identity that is different from their sex registered at birth in Welsh firms (1.6%) than in English firms (0.6%).
For Welsh firms, the difference between partners and solicitors was higher than for English firms:
- 0.4% of partners and 0.6% of solicitors in English firms had a gender identity that was different from their sex registered at birth.
- 0.3% of partners and 2.5% of solicitors in Welsh firms had a gender identity that was different from their sex registered at birth.
Additional resources
- Two interactive tools to explore our data:
- one that shows all the firm diversity data for 2025 that firms can use to benchmark their data
- another that shows all the firm diversity data we have collected since 2015 so that trends can be seen visually.
- Take a look at our helpful EDI resources for ways you can promote and encourage an inclusive workplace
- Read about the business benefits of a diverse and inclusive legal profession. Our business case for diversity provides practical examples of the actions firms can take and what we are doing to support firms.