Investigations and Enforcement – Diversity Monitoring Annual Report 2023/24
2 February 2026
About this report
Monitoring the diversity of individuals in our enforcement processes and taking action on the findings is a vital part of embedding equality, diversity and inclusion in the work we do.
This report sets out the diversity breakdown of individuals in our investigation and enforcement processes over our business year 2023/24 (from 1 November 2023 to 31 October 2024). We provide a breakdown by sex, ethnicity, age and, where numbers are sufficient, by disability, in two main areas. These are:
- individuals subject to our investigations and enforcement processes
- individuals who had a condition imposed on their practising certificate.
Our annual investigations and enforcement data publication provides more information about this work, including an overview of the action we have taken against the firms, solicitors and other individuals we regulate.
The key findings reported in this section are those which are statistically significant. Testing for statistical significance means we can be reasonably confident that the observed differences were not due to random chance alone. We use the terms 'overrepresentation' and 'underrepresentation' to describe the differences which were statistically significant.
Individuals subject to our investigation and enforcement processes
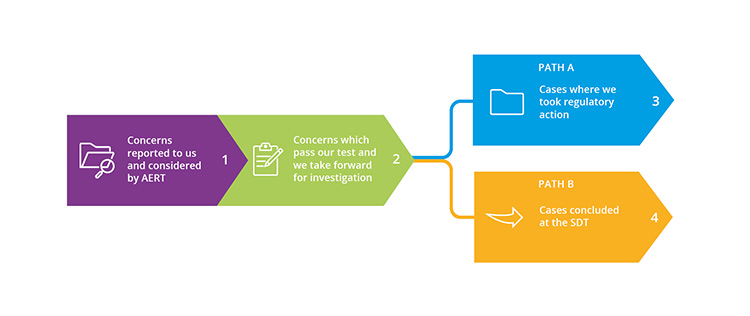
For the analysis in this report, we have looked at four stages of our investigation and enforcement processes. Individuals may be counted multiple times if they have been named on more than one concern. The numbers involved at the four stages of these processes in 2023/24 are set out below:
- Stage 1 – 8,555 individuals named on concerns reported to us which are considered by our Assessment and Early Resolution Team (AERT).
- Stage 2 – 1,457 individuals named on concerns which passed our assessment threshold test and which we took forward for an investigation.
- Stage 3 (path A) – 532 individuals named on cases where we took regulatory action (either by AERT or as a result of an investigation).
- Stage 4 (path B) – 83 individuals named on cases which were concluded at the SDT by way of a hearing or an agreed outcome.
The diagram below illustrates these stages and paths.
The key findings for individuals in our investigation and enforcement processes were:
- Black, Asian and minority ethnic individuals (as one group) and men were overrepresented compared with the practising population in concerns reported to us (stage 1) and at stage 2, when cases pass our assessment threshold test and we decide to investigate them. Similar patterns have been seen over the past five years for both groups.
- In relation to age, compared with their respective proportions in the practising population, individuals aged 45–65+ were overrepresented at stage 1 and those aged 25–44 were underrepresented. There were no statistically significant differences at stage 2 for age. Similar patterns have been seen for these stages over the past five years for both groups.
- Stage 3: Those aged 16-44 made up 26% (131 individuals) of all stage 3 cases, but were a much higher proportion (45%, 21 individuals) of those given advice at stage 3. While this difference was statistically significant, it is based on small numbers. However, individuals aged 16-44 made up 55% of the practising population.
There were no statistically significant differences for disability. And save for the finding set out above for age, there were no other statistically significant differences at stages 3 and 4.
Individuals with a condition on their practising certificate
This is the second year we have reported on practising certificate conditions. In 2023/24, we imposed conditions on 224 individuals.
Conditions restrict or prevent an individual from carrying out certain activity. There are typically three situations in which we impose practising conditions:
- A condition imposed as an outcome to an investigation where we have made a finding of misconduct.
- An interim condition, which we impose during an investigation and pending the final outcome of an investigation to limit risk of harm to the public. We will monitor these conditions as we progress an investigation.
- A condition imposed (or reimposed) where we are satisfied that the individual is unsuitable to undertake certain activities or otherwise presents a risk to the public interest. These conditions are imposed (or reimposed) under our Authorisation rules, often at practice certificate renewal, and are not necessarily linked to an investigation
The SDT can impose conditions on firms or solicitors as part of its final outcome. It has a wide discretion as to what conditions it can impose. For this report, we have not been able to include a diversity breakdown of conditions imposed by the SDT as the numbers involved are too small to report on.
The patterns of overrepresentation seen in the practising conditions data were similar to those seen in 2022/23 and to those seen in investigation and enforcement.
The key findings for individuals on whom we imposed practising conditions were:
- Black, Asian and minority ethnic individuals (as one group) and men were overrepresented compared with the practising population
- individuals aged 55 and over were overrepresented and individuals aged 16–44 were underrepresented compared with the practising population.
Our response
Given the longstanding patterns seen in our annual monitoring reports, in particular for Black, Asian and minority ethnic individuals at stages 1 and 2, we commissioned research to provide insight into the factors driving this overrepresentation. The research was carried out by the universities of York, Cardiff and Lancaster and involved an in-depth analysis of our data over four years, from 2018 to 2022.
The research, reported in October 2024, provides insight into the factors which affect the overrepresentation of Black, Asian and minority ethnic solicitors, but the picture is complex. The research described our assessment processes as being 'for the most part, as robust as they can be'. We agreed to take steps to further strengthen our approach and have started implementing the commitments we made when publishing the research.
This report is about the diversity of individuals subject to our investigation and enforcement work from 1 November 2023 to 31 October 2024. We also receive reports raising concerns about the conduct of law firms which are not covered here but are included in the annual investigations and enforcement data publication.
Our focus for this annual report is the regulatory activity taken in the reporting year. It does not follow the progress of a single cohort of individuals through the various stages of our investigation and enforcement processes.
Many, but not all, of the individuals reported to us in 2023/24 (captured in the stage 1 analysis) will also be in the stage 2 analysis of investigations. This is because we generally decide whether to investigate a reported concern within two months of receiving it. It may take longer than one year for an investigation to be concluded, and an outcome reached. This means it is unlikely that many of the individuals who were reported to us in 2023/24 are represented in the regulatory action we take in the same year (captured in the stage 3 analysis), or in the decisions made by the SDT (captured in the stage 4 analysis).
In relation to practising conditions, the report covers the conditions we imposed over the reporting year.
Comparison with the practising population
We have compared our data for 2023/24 with the practising population as it was on 1 November 2024. This data is set out in the 'Diversity profile of the practising population' section. We only include the known population – that is, the individuals for whom we hold diversity information. This varies at each stage of the process, but we have diversity information about:
- 99.98% of the practising population (this is shown as 100% due to rounding) in relation to age
- 78% of the practising population in relation to sex
- 64% of the practising population in relation to ethnicity.
Because of the way we collected disability data in the past, we could not determine the declaration rate for disability with certainty for this report. This is because we were not able to differentiate between individuals who have actively declared they do not have a disability and those who have simply not answered the question. We have taken steps to rectify this going forward, but in this analysis, we can only refer to the proportion of individuals who have declared a disability, which is 1% of the practising population. We suspect there is a sizeable underreporting of disability data within this data set, given that the diversity data we collected in 2023 from law firms showed that 6% of lawyers in law firms were disabled.
Data concerning individuals
We have a role in regulating everyone working in a law firm, so we can and do investigate concerns about all individuals working in law firms, not just solicitors. When we use the term 'individuals' in our investigation and enforcement processes, this includes practising solicitors, lawyers from overseas, paralegals, legal secretaries, non-lawyer managers and others working in law firms. All these individuals are included in the overall count of people at the various stages of our process. However, we do not have diversity data for individuals who are not solicitors so we cannot include them in our analysis by diversity group.
Ethnicity groups
We break ethnicity down into five main groups: White, Black, Asian, Mixed and Other ethnic group. Where the numbers in each group are large enough to report without the risk of identifying individuals, we report data about each group separately. Where the numbers get too small (at stages 3 and 4 and where we report on practising conditions), we compare the White group (which includes minority White groups) to the other four groups, which we refer to as the Black, Asian and minority ethnic group.
Drawing conclusions based on small numbers
The number of individuals against whom we took regulatory action at stage 3 (532), or who were named on cases concluded at the SDT at stage 4 (83) in the reporting period can be small when broken down by diversity group. This is also the case for those upon whom we imposed practising conditions in the reporting year (224). We have also provided the numbers of individuals involved, as percentage breakdowns can be misleading.
This section covers:
- Stage 1 – individuals named on concerns reported to us
- Stage 2 – individuals named on concerns which passed our assessment threshold test and were taken forward for investigation
The concerns we receive at stage 1 are considered by AERT at stage 2.
We focus on the concerns received and assessment decisions made in 2023/24. Any patterns identified over the past six years at stages 1 and 2 are highlighted in the 'Investigation and enforcement – trends since 2018/19' section.
About the data
In 2023/24, 11,852 concerns were reported to us, 7,247 (61%) of which named one or more individuals (as opposed to firms). There were 8,555 individuals named on these concerns at stage 1. We counted an individual each time they were named, so some individuals may be counted more than once.
In the same period, 1,457 individuals were taken forward for investigation (stage 2). Many but not all of these individuals will be included in the group of individuals making up stage 1. This is because we generally decide whether to investigate a reported concern within two months of receiving it. However, some of those considered at stage 2 will have been reported to us in the previous year.
Broken down by four diversity characteristics (sex, ethnicity, age and disability), the charts and tables in this section show:
- the practising population
- stage 1 – individuals named on concerns reported to us in 2023/24
- stage 2 – individuals taken forward for investigation in 2023/24.
We show the data in tables for sex, ethnicity and age, but only tables for disability because the numbers are too small for a chart to be meaningful.
Our findings
Sex
Men were overrepresented in the concerns reported to us at stage 1 (62%) when compared with the practising population (47%). They were also overrepresented at stage 2 (74%) compared with stage 1. Both of these differences were statistically significant.
Stages 1 and 2 – breakdown by sex in 2023/24
| Sex | Men | Women |
|---|---|---|
| Practising population | 47% (64,174) | 53% (72,240) |
| Stage 1: Concerns reported to us | 62% (4,509) | 38% (2,715) |
| Stage 2: Concern passes test for investigation | 74% (832) | 26% (295) |
The proportions in the table are based on the following data:
- Practising population – sex was known for 136,424 of the 173,906 individuals in the practising population (78%).
- Stage 1 – sex was known for 7,224 of the 8,555 individuals named on concerns we received (84%).
- Stage 2 – sex was known for 1,127 of the 1,457 individuals named on cases which passed our
Ethnicity
The number of individuals counted at stages 1 and 2 of the process is large enough for us to show all five ethnic groups separately as we have in the chart above. This is not the case for stages 3 and 4, where the numbers are too small. We have, therefore, added the total for the Black, Asian and minority ethnic group in the table below, to allow for comparison across all stages of our processes.
Looking at the Black, Asian and minority ethnic group as a whole, there was an overrepresentation of individuals from this group reported to us at stage 1 (26%) compared with the practising population (19%). They were also overrepresented at stage 2 (33%) when compared with stage 1. Both of these differences were statistically significant.
The proportions for the Asian and Black groups are:
- Asian – 13% of the practising population, 20% of the individuals at stage 1 and 24% of individuals at stage 2
- Black – 3% of the practising population, 4% of individuals at stage 1 and 6% of the individuals at stage 2.
There was an underrepresentation of White individuals at stage 1 (74%) compared with the practising population (81%). They were also underrepresented at stage 2 (67%) when compared with stage 1. Both of these differences were statistically significant.
Stages 1 and 2 – breakdown by ethnicity in 2023/24
| Ethnicity | Practising population | Stage 1: Concerns reported to us | Stage 2: Concern passes test for investigation | |||
|---|---|---|---|---|---|---|
| White | 81% (89,885) | 74% (4,661) | 67% (668) | |||
| Asian | 13% (13,984) | 19% (21,323) | 20% (1,230) | 26% (1,645) | 24% (243) | 33% (334) |
| Black | 3% (3,297) | 4% (261) | 6% (59) | |||
| Mixed | 2% (2,206) | 1% (79) | 1% (10) | |||
| Other | 2% (1,836) | 1% (75) | 2% (22) | |||
Please note, percentages may not add up to 100% due to rounding.
The proportions in the table are based on the following data:
- Practising population – ethnicity was known for 111,208 of the 173,906 in the practising population (64%).
- Stage 1 – ethnicity was known for 6,306 of the 8,555 individuals named on concerns we received (74%).
- Stage 2 – ethnicity was known for 1,002 of the 1,457 individuals named on cases which passed our assessment threshold test and which were taken forward for investigation (69%).
Age
Individuals in the two age categories covering 25–44 were underrepresented in the concerns reported to us at stage 1 compared with their respective proportions in the practising population. These differences were statistically significant. There was a lower proportion at stage 2 for these groups when compared with stage 1, but this was not statistically significant. We have been able to include the youngest age category (16–24) but the numbers are too small to draw conclusions.
All three of the older age groups (covering 45–65+) were overrepresented at stage 1 compared with their respective proportions in the practising population. This difference was statistically significant. The changes in proportion for all the older age groups from stage 1 to stage 2 were not statistically significant.
Stages 1 and 2 – breakdown by age in 2023/24
| Age | Practising population | Stage 1: Concerns reported to us | Stage 2: Concern passes test for investigation |
|---|---|---|---|
| 16–24 | 0.2% (412) | 1% (48) | 1% (9) |
| 25–34 | 24% (41,459) | 13% (1,113) | 11% (152) |
| 35–44 | 31% (54,248) | 25% (2,118) | 24% (328) |
| 45–54 | 25% (43,782) | 28% (2,366) | 30% (405) |
| 55–64 | 15% (25,254) | 21% (1,789) | 19% (259) |
| 65+ | 5% (8,709) | 12% (982) | 15% (201) |
The proportions in the table are based on the following:
- Practising population – age was known for 173,864 of the 173,906 individuals in the practising population (100%).
- Stage 1 – age was known for 8,416 of the 8,555 individuals named on concerns we received (98%).
- Stage 2 – age was known for 1,354 of the 1,457 individuals named on cases which passed our assessment threshold test and which were taken forward for investigation (93%).
Disability
There was a higher proportion of disabled individuals at stage 1 and 2 (both 2%) compared with the practising population (1%). We are not able to draw any reliable conclusions in relation to disability because the numbers are so small.
Stages 1 and 2 – breakdown by disability in 2023/24
| Disability | No disability recorded | Disability recorded |
|---|---|---|
| Practising population | 99% (171,656) | 1% (2,250) |
| Stage 1: Concerns reported to us | 98% (8,389) | 2% (166) |
| Stage 2: Concern passes test for investigation | 98% (1,428) | 2% (29) |
This section concerns the individuals at stage 3 – those against whom we took regulatory action in the reporting year. Regulatory action includes:
- issuing a warning or advice
- imposing a sanction, such as a rebuke or a fine
- intervening into an individual's practice
- imposing practising conditions
- making a section 43 or section 99 order
- cases where an individual agrees to be removed from the roll of solicitors.
Please note, 'issuing a warning or advice' used to be known as 'letter of warning or advice' and before that 'finding/finding and letter of warning'. We updated the name following a change in process, where the warning or advice is now issued in a formal decision document instead of a letter, and to better reflect the wording in our Standards and Regulations. More information about the different types of regulatory action referred to in this section can be found in our annual investigations and enforcement data publication.
To provide context, we first compare the breakdown at this stage with the breakdown of individuals named on cases which we took forward for investigation (stage 2). However, the individuals considered at stage 2 will not be the same individuals considered at stage 3. This is because investigations may not all be concluded within the same year.
We then compare the overall proportions of each group at stage 3, with the proportions of those groups within each type of regulatory action. For example, if men made up 50% of all individuals at stage 3, we might also expect them to make up around 50% of individuals who were issued advice, and around 50% of individuals who we sanctioned with a rebuke etc. This allows us to see whether there are any regulatory actions that are taken against a given group, that are disproportionate compared with the proportion of each group in stage 3 overall.
We focus on the cases closed in 2023/24 where we took regulatory action. Any meaningful patterns identified over the past six years at stage 3 are highlighted in the 'Investigation and enforcement – trends since 2018/19' section.
About the data
There are two sets of charts and tables for each diversity characteristic in this section. We show the data in charts and tables for sex, ethnicity and age, but not for disability because the numbers are too small for a chart to be meaningful. The first set of charts and tables show the breakdown of individuals at stages 1, 2 and 3. The second set of charts and tables provide a breakdown of individuals by the type of regulatory action taken at stage 3.
Breakdown of individuals at stages 1, 2 and 3
The first set of charts and tables for each diversity characteristic show the profile of the individuals at each of the following stages:
- stage 1 – individuals named on concerns reported to us in 2023/24
- stage 2 – individuals named on concerns which passed our assessment threshold test and which we took forward for an investigation in 2023/24
- stage 3 – individuals named on cases where we took regulatory action (either by AERT or as a result of an investigation).
There were 532 individuals against whom we took regulatory action at stage 3 in 2023/24.
Breakdown of individuals by type of regulatory action taken
The second set of charts and tables for each diversity characteristic show the profile of individuals by the type of regulatory action taken. There were 336 regulatory actions, relating to 328 individuals, in the second table, covering:
- those to whom we issued a warning or advice
- those who we sanctioned with a rebuke or a fine
- individuals whose practice we intervened into.
Please note, the final category only relates to interventions into a person's individual practice, not interventions into a firm, so does not include interventions into firms which are authorised as 'sole practices'.
Individuals covered in the second set of charts and tables may have more than one regulatory action recorded against them. If so, they will appear more than once in the analysis.
We have not provided this breakdown for all types of regulatory action. The actions that are not included in the second set of tables are:
- Practising conditions imposed, because they are included in a separate section: 'Conditions imposed on practising certificates'.
- Section 43 or section 99 orders. This is because these orders are imposed on non-lawyers working in the law firms and businesses we regulate, and we do not hold diversity data for these individuals.
- Removal from the roll of solicitors by way of a regulatory settlement agreement. This is because the numbers are too small to report on.
Because these types of actions are not included in the second set of charts and tables, but the individuals they relate to are included in the total number of individuals at stage 3, the total number of individuals under each action type will not add up to the total number at stage 3. Additionally, the individuals included in the total number at stage 3 are only counted once even if they had multiple actions taken against them. However, individuals in the second set of tables and charts who had more than one regulatory action recorded against them will be counted under each type of regulatory action. This applies to every characteristic in this section.
Regulatory action taken by AERT
Most cases which pass our assessment threshold test are referred for an investigation, which will determine whether regulatory action is warranted.
In some cases, rather than referring the case for an investigation, regulatory action can be taken by AERT (issuing a warning or advice). This will only happen in cases which have passed the assessment threshold test. And typically, this only happens in cases where there has been a clear breach of our rules, but circumstances indicate there is no underlying concern in terms of the public interest and public protection.
Thirteen individuals were issued a warning or advice in these circumstances by AERT in 2023/24. They are included in the stage 3 analysis (because regulatory action was taken against them), but not in the stage 2 analysis (because they were not taken forward for an investigation).
Limits in the data we can report and the conclusions we can draw
To avoid the risk of individuals being identified from this analysis, there are limitations in what we have been able to report in this section due to the small numbers involved:
- We have not been able to report separately on the groups making up the Black, Asian and minority ethnic group.
- We have grouped together the rebukes and fines categories for ethnicity.
- We have not been able to include a breakdown of the regulatory action that we have taken by disability (so this section does not have a second table).
- We have grouped together the 16–24 and 25–34 age categories in the stage 3 analysis (set out in the first table concerning age). We have also grouped together the 16–24, 25–34 and 35–44 age groups when looking at regulatory action taken (set out in the second table concerning age).
There are small numbers involved at stage 3 (532 individuals) when broken down by diversity group, which makes it difficult to draw conclusions. There was only one difference highlighted as statistically significant at this stage and that was the overrepresentation of younger individuals who were issued advice compared with the proportion of individuals in that age group at stage 3. This has been noted in the relevant section below.
Our findings
Sex
Breakdown of individuals by sex at stages 1, 2 and 3 (path A) in 2023/24
There was a higher proportion of individuals at stage 3 who were men (75%) when compared with stage 2 (74%). And a corresponding lower proportion of individuals who were women, 26% at stage 2 and 25% at stage 3.
| Sex | Men | Women |
|---|---|---|
| Stage 1: Concerns reported to us | 62% (4,509) | 38% (2,715) |
| Stage 2: Concern passes test for investigation | 74% (832) | 26% (295) |
| Stage 3 (path A): Cases where we took regulatory action (either by AERT or as a result of an investigation) | 75% (324) | 25% (106) |
Of the 532 individuals named on cases where we took regulatory action at stage 3, sex was known for 430 (81%).
Breakdown by sex of individuals by type of regulatory action taken in 2023/24
The proportion of men at stage 3 was 75%. The proportion of men represented across the different types of regulatory actions varied. It was lower for warnings (66%), fines (70%) and interventions (74%) and higher for advice (78%) and rebukes (76%), compared with stage 3 overall.
The proportion of women at stage 3 was 25%. A higher proportion of women were issued a warning (34%), a fine (30%) or an intervention (26%) compared with stage 3 overall. It was lower for the other regulatory action types (22% for advice and 24% for rebukes).
| Sex | Men | Women |
|---|---|---|
| Stage 3 (path A): Cases where we took regulatory action (either by AERT or as a result of an investigation) | 75% (324) | 25% (106) |
| Advice | 78% (29) | 22% (8) |
| Warning | 66% (48) | 34% (25) |
| Rebuke | 76% (25) | 24% (8) |
| Fine | 70% (26) | 30% (11) |
| Intervention | 74% (40) | 26% (14) |
Sex was known for:
- 37 of the 47 individuals who were issued advice (79%)
- 73 of the 87 individuals who were issued a warning (84%)
- 33 of the 38 individuals who received rebukes (87%)
- 37 of the 38 individuals who received fines (97%)
- 54 of the 61 individuals where an intervention took place into their practice (89%).
Ethnicity
Breakdown by ethnicity of individuals at stages 1, 2 and 3 (path A) in 2023/24
The proportion of individuals at stage 3 who were from a Black, Asian or minority ethnic background was 35%, which was higher than at stage 2 (33%). The proportion of individuals at stage 3 who were White was 65%, compared with 67% at stage 2.
| Ethnicity | White | Black, Asian and minority ethnic |
|---|---|---|
| Stage 1: Concerns reported to us | 74% (4,661) | 26% (1,645) |
| Stage 2: Concern passes test for investigation | 67% (668) | 33% (334) |
| Stage 3 (path A): Cases where we took regulatory action (either by AERT or as a result of an investigation) | 65% (240) | 35% (129) |
Of the 532 individuals named on cases where we took regulatory action at stage 3, ethnicity was known for 369 (69%).
Breakdown by ethnicity of individuals by type of regulatory action taken in 2024/24
The proportion of Black, Asian and minority ethnic individuals at stage 3 was 35%. For all types of regulatory action taken, the proportion of individuals from Black, Asian and minority ethnic backgrounds was lower compared with stage 3 overall. This includes letters of advice (31%), letters of warning (24%), rebuke or fines (25%) and interventions (26%). For White individuals, who proportionally made up 65% of individuals at stage 3 overall, the proportions were higher for all types of regulatory action taken.
| Ethnicity | White | Black, Asian and minority ethnic |
|---|---|---|
| Stage 3 (path A): Cases where we took regulatory action (either by AERT or as a result of an investigation) | 65% (240) | 35% (129) |
| Advice | 69% (22) | 31% (10) |
| Warning | 76% (45) | 24% (14) |
| Rebuke or fine | 75% (44) | 25% (15) |
| Intervention | 74% (35) | 26% (12) |
Ethnicity was known for:
- 32 of the 47 individuals who were issued advice (68%)
- 59 of the 87 individuals who were issued a warning (68%)
- 59 of the 76 individuals who received rebukes or fines (78%)
- 47 of the 67 individuals where an intervention took place into their practice (77%).
Age
Breakdown by age of individuals at stages 1, 2 and 3 (path A) in 2023/24
For the younger categories (covering 16–44) the proportion of individuals declined through stages 1 to 3. Conversely, for the 65+ age category, the proportion increased through stages 1 to 3. For the age groups in between (covering 45–64), proportions were broadly consistent across the stages.
| Age | 16–34 | 35–44 | 45–54 | 55–64 | 65+ |
|---|---|---|---|---|---|
| Stage 1: Concerns reported to us | 14% (1,161) | 25% (2,118) | 28% (2,366) | 21% (1,789) | 12% (982) |
| Stage 2: Concern passes test for investigation | 12% (161) | 24% (328) | 30% (405) | 19% (259) | 15% (201) |
| Stage 3 (path A): Cases where we took regulatory action (either by AERT or as a result of an investigation) | 8% (38) | 19% (93) | 28% (141) | 25% (123) | 20% (100) |
Of the 532 individuals named on cases where we took regulatory action at stage 3, age was known for 495 individuals (93%).
Breakdown by age of individuals by type of regulatory action taken in 2023/24
There was an overrepresentation of individuals in the 16–44 category who were issued advice (45%) compared with the overall proportion of this age group at stage 3 (26%). Although this relates to only 21 people, this link between age group and being given advice at stage 3 is statistically significant. None of the other differences in type of regulatory action by age are statistically significant.
| Age | 16–44 | 45–54 | 55–64 | 65+ |
|---|---|---|---|---|
| Stage 3 (path A): Cases where we took regulatory action (either by AERT or as a result of an investigation) | 26% (131) | 28% (141) | 25% (123) | 20% (100) |
| Advice | 45% (21) | 21% (10) | 13% (6) | 21% (10) |
| Warning | 38% (32) | 21% (18) | 24% (20) | 17% (14) |
| Rebuke | 32% (11) | 26% (9) | 18% (6) | 24% (8) |
| Fine | 34% (13) | 26% (10) | 24% (9) | 16% (6) |
| Intervention | 15% (9) | 25% (15) | 25% (15) | 35% (21) |
Please note that:
- some percentages do not add up to 100%, due to rounding
- while there were individuals in the 16–24 age category at stage 3, none of them were issued any of these sanction types.
Age was known for:
- 47 of the 47 individuals who were issued advice (100%)
- 84 of the 87 individuals who were issued a warning (97%)
- 34 of the 38 individuals who received rebukes (89%)
- 38 of the 38 individuals who received fines (100%)
- 60 of the 61 individuals where an intervention took place into their practice (98%).
Disability
The findings at stage 3 relate to nine disabled individuals. The small number involved at this stage and the low declaration rates concerning disability mean we cannot draw any conclusions.
| Disability | No disability recorded | Disability recorded |
|---|---|---|
| Stage 1: Concerns reported to us | 98% (8,389) | 2% (166) |
| Stage 2: Concern passes test for investigation | 98% (1,428) | 2% (29) |
| Stage 3 (path A): Cases where we took regulatory action (either by AERT or as a result of an investigation) | 98% (523) | 2% (9) |
This section concerns individuals at stage 4 – those named on cases concluded at the SDT in the reporting year. We prosecute the most serious cases at the SDT. It is the SDT that makes the decisions in the cases referred to in this section. It is independent of us and can impose more severe sanctions than we can. The sanctions include an unlimited fine for any category of rule breach, suspension or strike off.
In the first part of this section, we look at the breakdown of individuals named on cases concluded at the SDT and a breakdown of the sanctions imposed by the SDT. In the second part we look at how these outcomes were reached (whether the sanctions were imposed by an agreed outcome or following a hearing at the SDT).
About the data – breakdown of individuals and sanctions at the SDT
To provide context, we compare the breakdown of individuals named on cases concluded at the SDT (stage 4), with the breakdown of individuals named on cases which we took forward for investigation (stage 2). However, the individuals considered at stage 2 will not be the same individuals considered at stage 4. This is because cases will not all be investigated, referred to the SDT and concluded by the SDT within the same year. We focus on the cases referred for investigation and those heard at the SDT in 2023/24 in this section.
We then compare the overall proportions of each group at stage 4, with the proportions of those groups within each type of sanction taken by the SDT. For example, if men made up 50% of all individuals at stage 3, we might expect them to make up around 50% of individuals who were suspended, and around 50% of individuals who were struck off etc. This allows us to see whether there are any sanctions that are taken against a given group, that are disproportionate compared with the proportion of each group in stage 4 overall.
When considering the individuals at stage 4, there is a chart and two tables for each diversity characteristic. The chart shows the information from both tables. The first table shows the breakdown of individuals at stages 1, 2 and 4. The second table provides a breakdown of individuals by the type of SDT sanction imposed.
Breakdown of individuals at stages 1, 2 and 4
The first table for each diversity characteristic shows the profile of individuals at each of the following stages:
- stage 1 – individuals named on concerns reported to us in 2023/24
- stage 2 – individuals named on cases which passed our assessment threshold test and which we took forward for investigation in 2023/24
- stage 4 – individuals named on cases concluded at the SDT.
There were 83 individuals who were named on cases concluded at the SDT at stage 4 in 2023/24.
Breakdown of individuals by type of SDT sanction
The second table for each diversity characteristic shows the profile of individuals by the type of SDT sanction imposed. We prosecuted 78 cases which were concluded at the SDT in 2023/24. These concerned 83 individuals. We have discounted any decisions the SDT made concerning firms or against individuals where there was no order.
The second table covers the following sanctions: fines, suspensions and strike offs. Some individuals covered in the second table may have more than one of these sanctions recorded against them and will therefore appear more than once in the analysis.
Limits in the data we can report and the conclusions we can draw
To avoid the risk of individuals being identified from this analysis, there are limitations in what we have been able to report in this section due to the small numbers involved:
- We have not been able to report separately on the groups making up the Black, Asian and minority ethnic group.
- We have not been able to include a breakdown of the cases concluded at the SDT (stage 4) by disability.
- We have not been able to show all the sanctions for all diversity characteristics - for ethnicity, we have not been able to report on suspensions, and for age and sex we have only been able to report on strike offs.
- We have grouped together the 25–34 and 35–44 age categories. There were no individuals from the 16–24 age group at stage 4.
- We have not included data relating to individuals against whom there were 'other' decisions – which include, for example, a reprimand or a section 43 order.
Because some of the sanctions are not included in the second set of charts and tables, but the individuals they relate to are included in the total number of individuals at stage 4, the total number of individuals under each sanction type will not add up to the total number at stage 4. Additionally, the individuals included in the total number at stage 4 are only counted once even if they had multiple sanctions taken against them. However, individuals in the second set of tables and charts who had more than one sanction recorded against them will be counted under each type of sanction. This applies to every characteristic in this section.
There are very small numbers involved at stage 4 (83 individuals) which makes it difficult to draw conclusions when broken down by diversity group. None of the results in this section are statistically significant.
Our findings – breakdown of individuals and sanctions at the SDT
Sex
Breakdown by sex of individuals at stages 1, 2 and 4 (path B) in 2023/24
There was a lower proportion of individuals at stage 4 who were men (69%) compared with stage 2 (74%). And a corresponding higher proportion of individuals who were women, 26% at stage 2 and 31% at stage 4.
| Sex | Men | Women |
|---|---|---|
| Stage 1: Concerns reported to us | 62% (4,509) | 38% (2,715) |
| Stage 2: Concern passes test for investigation | 74% (832) | 26% (295) |
| Stage 4 (path B): Cases concluded at SDT | 69% (55) | 31% (25) |
Sex was known for 80 of the 83 individuals named on cases concluded at the SDT (96%).
Breakdown by sex of individuals by type of SDT sanction in 2023/24
Men made up 71% of individuals who were struck off and 69% at stage 4. Women made up 29% of individuals who were struck off and 31% at stage 4.
| Sex | Men | Women |
|---|---|---|
| Stage 4 (path B): Cases concluded at SDT | 69% (55) | 31% (25) |
| Strike off | 71% (30) | 29% (12) |
Ethnicity
Breakdown by ethnicity of individuals at stages 1, 2 and 4 (path B) in 2023/24
The proportion of individuals from a Black, Asian or minority ethnic background at stage 4 was 36%, which was higher than at stage 2 (33%). The proportion of individuals who were White was 64% at stage 4 and 67% at stage 2.
| Ethnicity | White | Black, Asian and minority ethnic |
|---|---|---|
| Stage 1: Concerns reported to us | 74% (4,661) | 26% (1,645) |
| Stage 2: Concern passes test for investigation | 67% (668) | 33% (334) |
| Stage 4 (path B): Cases concluded at SDT | 64% (44) | 36% (25) |
Ethnicity was known for 69 of the 83 individuals named on cases concluded at the SDT (83%).
Breakdown by ethnicity of individuals by type of SDT sanction in 2023/24
The proportion of Black, Asian and minority ethnic individuals at stage 4 was 36%. For fines, the proportion of individuals from Black, Asian and minority ethnic backgrounds was higher compared with their proportion at stage 4 overall (40%). However, for strike offs, the proportion was lower than at stage 4 overall (34%). For White individuals, who proportionally made up 64% of individuals at stage 4, the proportion was higher for strike offs (66%) and lower for fines (60%).
| Ethnicity | White | Black, Asian and minority ethnic |
|---|---|---|
| Stage 4 (path B): Cases concluded at SDT | 64% (44) | 36% (25) |
| Fine | 60% (9) | 40% (6) |
| Strike off | 66% (23) | 34% (12) |
Ethnicity was known for 15 of the 16 individuals who were given a fine (94%) and 35 of the 42 individuals who were struck off (74%).
Age
Breakdown by age of individuals at stages 1, 2 and 4 (path B) in 2023/24
Those aged 44 and under made up a declining proportion of individuals through stages 1, 2 and 4, with 38% at stage 1, 35% at stage 2 and 29% at stage 4.
| Age | 25–44 | 45–54 | 55–64 | 65+ |
|---|---|---|---|---|
| Stage 1: Concerns reported to us | 38% (3,231) | 28% (2,366) | 21% (1,789) | 12% (982) |
| Stage 2: Concern passes test for investigation | 35% (480) | 30% (405) | 19% (259) | 15% (201) |
| Stage 4 (path B): Cases concluded at SDT | 29% (24) | 33% (27) | 27% (22) | 12% (10) |
Please note the percentages do not add up to 100% due to rounding.
Age was known for all 83 individuals named on cases concluded at the SDT (100%).
Breakdown by age of individuals by type of SDT sanction in 2023/24
The proportion of individuals struck off who were aged 44 and under and 65+ was higher than their respective proportions at stage 4. For the other age categories (45–54 and 55–64) it was lower than their respective proportions at stage 4.
| Age | 25–44 | 45–54 | 55–64 | 65+ |
|---|---|---|---|---|
| Stage 4 (path B): Cases concluded at SDT | 29% (24) | 33% (27) | 27% (22) | 12% (10) |
| Strike off | 33% (14) | 29% (12) | 24% (10) | 14% (6) |
About the data – agreed outcomes
The SDT rules allow for a case to be resolved by way of an agreed outcome. Agreed outcomes are agreements to settle a case reached between us and the individual accused of misconduct (referred to as ‘the respondent’ at the SDT). Agreed outcomes have to be approved by the SDT.
The tables and charts in this section compare the diversity breakdown of those individuals whose case was concluded by agreed outcome and those whose case was concluded by a hearing. Of the 83 individuals whose cases were concluded at the SDT in 2023/24, 58 were concluded by a hearing and 25 by an agreed outcome.
Limits in the data we can report and the conclusions we can draw
To avoid the risk of the individuals being identified from this analysis, there are limitations in what we have been able to report in this section:
- We have not been able to include a breakdown by ethnicity or disability.
- We have grouped together the younger age categories (25–44) and the older age categories (45–65+). There were no individuals in the 16–24 age group at this stage.
Because of the small numbers involved in agreed outcomes (25 individuals), none of the results in this section are statistically significant. Any differences between groups should, therefore, be treated with caution.
Our findings – agreed outcomes
Sex
A larger proportion of men concluded their case at an SDT hearing (71%) than women (68%). A larger proportion of women concluded their case by agreed outcome (32%) than men (29%).
Agreed outcomes – breakdown by sex
| Sex | Cases concluded at SDT hearing | Cases concluded by SDT agreed outcome |
|---|---|---|
| Men | 71% (39) | 29% (16) |
| Women | 68% (17) | 32% (8) |
Sex was known for 24 out of 25 individuals named on cases concluded at the SDT by way of an agreed outcome (96%). It was known for 56 of the 58 individuals where a case was concluded by an SDT hearing (97%).
Age
A larger proportion of the older age group concluded their case at an SDT hearing (76%) than the younger age group (54%). For cases concluded by agreed outcome, a larger proportion of individuals in the younger age group concluded their case by agreed outcome (46%) than the older age group (24%).
Agreed outcomes – breakdown by age
| Age | Cases concluded at SDT hearing | Cases concluded by SDT agreed outcome |
|---|---|---|
| 25–44 | 54% (13) | 46% (11) |
| 45–65+ | 76% (45) | 24% (14) |
Age was known for 100% of the individuals named on cases concluded at the SDT.
This section sets out the diversity breakdown of individuals where we imposed a condition on their practising certificate between 1 November 2023 and 31 October 2024. As this report is about the diversity breakdown of individuals, we have not included data about the conditions imposed on firms. Information related to the conditions imposed on firms can be found in our 'investigations and enforcement data publication'. We have not included information about conditions imposed by the SDT as numbers were too small.
About the data
In 2023/24, there were 224 cases where we imposed a condition on an individual's practising certificate. These cases involved 218 individuals. If an individual had more than one condition imposed on their practising certificate during the year, we have only counted them once for the purposes of this analysis. This is why there are fewer individuals when compared with cases.
Conditions restrict or prevent an individual from carrying out certain activity. There are typically three situations in which we impose practising conditions:
- A condition imposed as an outcome to an investigation where we have made a finding of misconduct.
- An interim condition, which we impose during an investigation and pending the final outcome of an investigation to limit risk of harm to the public. We will monitor these conditions as we progress an investigation.
- A condition imposed (or reimposed) where we are satisfied that the individual is unsuitable to undertake certain activities or otherwise presents a risk to the public interest. These conditions are imposed (or reimposed) under our Authorisation rules, often at practice certificate renewal, and are not necessarily linked to an investigation.
Because we can impose conditions when a practising certificate is renewed or during an ongoing investigation, it is more meaningful to compare this data with the practising population, rather than one of the four stages set out earlier in the report.
Limits in the data we can report
To avoid the risk of the individuals being identified from this analysis, there are limitations in what we have been able to report in this section:
- We have not been able to report separately on the groups making up the Black, Asian and minority ethnic group due to the small numbers.
- Age: there were no individuals aged 16–24 who had practising conditions imposed by us. We have grouped together the 16–24, 25–34 and 35–44 age categories in the conditions imposed by us, due to small numbers.
Our findings
Sex
Men were overrepresented across individuals on whom we imposed a practising condition (81%), compared with 47% of men in the practising population. Conversely, women were underrepresented across individuals on whom we imposed a practising condition (19%), compared with 53% of women in the practising population. Both of these differences were statistically significant.
| Sex | Men | Women |
|---|---|---|
| Practising population | 47% (64,174) | 53% (72,240) |
| Practising conditions we imposed | 81% (172) | 19% (41) |
Ethnicity
Black, Asian and minority ethnic individuals were overrepresented across individuals on whom we imposed a practising condition (56%), compared with 19% in the practising population. Conversely, White individuals were underrepresented across individuals on whom we imposed a practising condition (44%), compared with 81% in the practising population. Both of these differences were statistically significant.
| Ethnicity | White | Black, Asian and minority ethnic |
|---|---|---|
| Practising population | 81% (89,885) | 19% (21,323) |
| Practising conditions we imposed | 44% (82) | 56% (105) |
The proportions in the table are based on the following data:
- Practising population – ethnicity was known for 111,208 of the 173,906 in the practising population (64%).
- Practising conditions we imposed – ethnicity was known for 187 of the 218 individuals who had a condition imposed (86%).
Age
Individuals aged 55 and over were overrepresented across individuals on whom we imposed a practising condition compared with their respective proportions in the practising population. This difference was statistically significant. The proportion of individuals aged 45–54 was higher than their proportion in the practising population, but this was not statistically significant.
The reverse was true for the younger age group shown here (16–44). Individuals aged 44 and younger were underrepresented across individuals on whom we imposed a practising condition compared with the practising population. This difference was statistically significant. Please note, no individuals from the 16–24 age group had conditions imposed.
| Age | 16–44 | 45–54 | 55–64 | 65+ |
|---|---|---|---|---|
| Practising population | 55% (96,119) | 25% (43,782) | 15% (25,254) | 5% (8,709) |
| Practising conditions we imposed | 13% (29) | 33% (72) | 33% (71) | 21% (46) |
The proportions in the table are based on the following:
- Practising population – age was known for 173,864 of the 173,906 practising population (100%).
- Practising conditions we imposed – age was known for 218 of the 218 individuals who had a condition imposed (100%).
Disability
We cannot draw conclusions because the numbers involved are small.
| Disability | No disability recorded | Disability recorded |
|---|---|---|
| Practising population | 99% (171,656) | 1% (2,250) |
| Practising conditions we imposed | 97% (212) | 3% (6) |
This section sets out an overview of the diversity breakdown of individuals at four stages of the investigation and enforcement process. We have included data from earlier years so we can highlight any trends. There is more detail about the data for 2023/24 at each stage in later sections of this report.
The diversity breakdown is by sex, ethnicity, age and disability (where there was sufficient data to allow us to do this).
Breakdown by sex across the four stages of our enforcement process
For all six years, the proportion of individuals in the concerns we receive (stage 1) who were men was higher than compared with the practising population. For all six years, the proportion of men was higher at stage 2, the investigation stage, when a concern passes our assessment test.
Compared with the investigation stage (stage 2), the proportion of men we took regulatory action against (stage 3) was lower in the three years from 2018/19 to 2020/21. For the three years from 2021/22 to 2023/24, it was higher than at the investigation stage.
For the previous five years, the proportion of men in cases concluded at the SDT (stage 4) was higher than at the investigation stage (stage 2). However, in 2023/24, there was a lower proportion of men at stage 4 compared with the proportion at stage 2.
Practising population
| Sex | 2018/19 | 2019/20 | 2020/21 | 2021/22 | 2022/23 | 2023/24 | |
|---|---|---|---|---|---|---|---|
| Practising population | Men | 49% (74,657) | 48% (71,933) | 48% (70,928) | 47% (69,512) | 47% (68,244) | 47% (64,174) |
| Women | 51% (77,539) | 52% (77,769) | 52% (78,011) | 53% (76,987) | 53% (76,136) | 53% (72,240) | |
| Stage 1: Concerns reported to us and considered by AERT | Men | 67% (4,440) | 65% (3,959) | 62% (3,913) | 63% (3,894) | 63% (4,290) | 62% (4,509) |
| Women | 33% (2,161) | 35% (2,088) | 38% (2,365) | 37% (2,336) | 37% (2,536) | 38% (2,715) | |
| Stage 2: Concern passes test for investigation | Men | 73% (1,800) | 75% (1,166) | 68% (820) | 70% (804) | 72% (822) | 74% (832) |
| Women | 27% (661) | 25% (380) | 32% (393) | 30% (352) | 28% (323) | 26% (295) | |
| Stage 3 (path A): Cases where we took regulatory action (either by AERT or as a result of an investigation) | Men | 70% (159) | 73% (144) | 66% (105) | 74% (139) | 75% (151) | 75% (324) |
| Women | 30% (67) | 27% (53) | 34% (55) | 26% (49) | 25% (50) | 25% (106) | |
| Stage 4 (path B): Cases concluded at the SDT | Men | 85% (119) | 80% (99) | 73% (75) | 75% (61) | 78% (86) | 69% (55) |
| Women | 15% (21) | 20% (25) | 27% (28) | 25% (20) | 22% (24) | 31% (25) |
Breakdown by ethnicity across the four stages of our enforcement process
In this section, we have set out data for the White and the Black, Asian and minority ethnic groups (as a whole) to allow comparison across all stages. A more detailed analysis across all five ethnic groups for 2023/24 can be seen in the 'stages 1 and 2 – concerns reported to us, considered by AERT and taken forward for investigation' section.
For all six years, the proportion of individuals in the concerns we receive (stage 1) who were from a Black, Asian or minority ethnic background was higher compared with the practising population. And this proportion increased further at stage 2, when a concern passes our test for investigation.
There is no consistent pattern over time when comparing the investigation stage with the individuals we took regulatory action against at stage 3. In 2023/24, the proportion of Black, Asian and minority ethnic individuals at stage 3 was higher than at the investigation stage, but the previous year it was the same.
With the exception of 2019/20, the proportion of Black, Asian and minority ethnic individuals in cases concluded at the SDT (stage 4) was higher than the proportion at the investigation stage.
Practising population
| Ethnicity | 2018/19 | 2019/20 | 2020/21 | 2021/22 | 2022/23 | 2023/24 | |
|---|---|---|---|---|---|---|---|
| Practising population | White | 82% (99,098) | 82% (96,835) | 82% (99,078) | 81% (97,326) | 81% (95,626) | 81% (89,885) |
| Black, Asian and minority ethnic | 18% (21,085) | 18% (20,930) | 18% (22,223) | 19% (22,266) | 19% (22,313) | 19% (21,323) | |
| Stage 1: Concerns reported to us and considered by AERT | White | 74% (4,273) | 74% (3,864) | 75% (4,138) | 76% (4,172) | 76% (4,558) | 74% (4,661) |
| Black, Asian and minority ethnic | 26% (1,486) | 26% (1,327) | 25% (1,376) | 24% (1,307) | 24% (1,442) | 26% (1,645) | |
| Stage 2: Concern passes test for investigation | White | 68% (1,441) | 65% (870) | 67% (722) | 71% (727) | 71% (702) | 67% (668) |
| Black, Asian and minority ethnic | 32% (691) | 35% (460) | 33% (356) | 29% (295) | 29% (291) | 33% (334) | |
| Stage 3 (path A): Cases where we took regulatory action (either by AERT or as a result of an investigation) | White | 65% (129) | 71% (114) | 64% (90) | 69% (116) | 71% (127) | 65% (240) |
| Black, Asian and minority ethnic | 35% (68) | 29% (46) | 36% (51) | 31% (52) | 29% (52) | 35% (129) | |
| Stage 4 (path B): Cases concluded at the SDT | White | 65% (81) | 72% (81) | 66% (59) | 64% (47) | 59% (60) | 64% (44) |
| Black, Asian and minority ethnic | 35% (43) | 28% (31) | 34% (31) | 36% (26) | 41% (42) | 36% (25) |
Breakdown by age across the four stages of our enforcement process
Because of small numbers, we have combined the two youngest age groups: 16–24 and 25–34, showing data at each stage for individuals aged 16–34.
For all six years, the proportion of individuals in the younger age categories (covering 16–44) in concerns reported to us (stage 1) was lower than compared with their respective proportions in the practising population. For those in the three older age categories (covering 45 and over), there was a higher proportion at stage 1 when compared with their respective proportions in the practising population.
Broadly speaking, the proportions across all age groups for concerns reported to us (stage 1) and at the investigation stage (stage 2) are similar for all six years.
Looking at the cases where we took regulatory action (stage 3) and cases concluded at the SDT (stage 4), it is difficult to identify patterns over time for the age data compared with those at the investigation stage.
Practising population
| Age | 2018/19 | 2019/20 | 2020/21 | 2021/22 | 2022/23 | 2023/24 | |
|---|---|---|---|---|---|---|---|
| Practising population | 16–34 | 25% (39,593) | 24% (39,016) | 24% (38,927) | 23% (38,997) | 24% (40,628) | 24% (41,871) |
| 35–44 | 32% (50,885) | 33% (52,124) | 33% (53,371) | 33% (54,372) | 32% (55,305) | 31% (54,248) | |
| 45–54 | 24% (38,033) | 24% (39,146) | 24% (39,788) | 25% (41,220) | 25% (42,734) | 25% (43,782) | |
| 55–64 | 14% (21,378) | 14% (22,284) | 14% (22,787) | 14% (23,698) | 14% (25,009) | 15% (25,254) | |
| 65+ | 5% (7,280) | 5% (7,736) | 5% (8,001) | 5% (8,485) | 5% (9,037) | 5% (8,709) | |
| Stage 1: Concerns reported to us and considered by AERT | 16–34 | 12% (826) | 13% (799) | 14% (911) | 14% (954) | 13% (1,042) | 14% (1,161) |
| 35–44 | 26% (1,776) | 27% (1,680) | 26% (1,766) | 26% (1,794) | 26% (2,023) | 25% (2,118) | |
| 45–54 | 30% (1,992) | 28% (1,754) | 28% (1,915) | 27% (1,864) | 28% (2,188) | 28% (2,366) | |
| 55–64 | 22% (1,501) | 22% (1,403) | 21% (1,420) | 21% (1,439) | 21% (1,593) | 21% (1,789) | |
| 65+ | 10% (250) | 10% (616) | 11% (717) | 13% (867) | 12% (919) | 12% (982) | |
| Stage 2: Concern passes test for investigation | 16–34 | 11% (283) | 12% (190) | 10% (137) | 12% (165) | 12% (157) | 12% (161) |
| 35–44 | 26% (659) | 29% (479) | 25% (335) | 26% (337) | 25% (334) | 24% (328) | |
| 45–54 | 30% (751) | 28% (447) | 29% (386) | 27% (349) | 29% (390) | 30% (405) | |
| 55–64 | 23% (567) | 22% (358) | 23% (304) | 21% (275) | 20% (269) | 19% (259) | |
| 65+ | 10% (250) | 9% (150) | 12% (162) | 14% (187) | 14% (195) | 15% (201) | |
| Stage 3 (path A): Cases where we took regulatory action (either by AERT or as a result of an investigation) | 16–34 | 13% (34) | 14% (34) | 19% (44) | 12% (28) | 11% (25) | 8% (38) |
| 35–44 | 25% (64) | 28% (66) | 26% (60) | 22% (51) | 20% (47) | 19% (93) | |
| 45–54 | 27% (69) | 24% (56) | 25% (58) | 32% (73) | 25% (59) | 28% (141) | |
| 55–64 | 22% (55) | 20% (48) | 18% (43) | 16% (36) | 20% (48) | 25% (123) | |
| 65+ | 13% (33) | 14% (34) | 13% (30) | 18% (41) | 24% (57) | 20% (100) | |
| Stage 4 (path B): Cases concluded at the SDT | 16–34 | 9% (13) | 5% (6) | 7% (8) | 25% (21) * | 22% (24) * | 8% (7) |
| 35–44 | 27% (38) | 25% (31) | 19% (21) | 20% (17%) | |||
| 45–54 | 31% (44) | 30% (38) | 31% (34) | 33% (28) | 31% (34) | 33% (27) | |
| 55–64 | 20% (28) | 25% (31) | 28% (31) | 24% (20) | 27% (30) | 27% (22) | |
| 65+ | 13% (18) | 16% (20) | 14% (15) | 18% (15) | 21% (23) | 12% (10) |
* For 2021/22 and 2022/23, due to low numbers we combined the 16–34 and 35–44 age categories.
Please note, numbers may not add up to 100% due to rounding.
Breakdown by disability across the four stages of our enforcement processes
Because of the small numbers involved there are limitations in what we can report. The tables are marked with an asterisk when we cannot report the data without revealing these small numbers. This also means it is not possible to apply commentary on trends over time.
| Disability | 2018/19 | 2019/20 | 2020/21 | 2021/22 | 2022/23 | 2022/23 | |
|---|---|---|---|---|---|---|---|
| Practising population | No disability recorded | 99% (155,686) | 99% (158,835) | 99% (160,662) | 99% (164,480) | 99% (170,373) | 99% (171,656) |
| Disability recorded | 1% (1,673) | 1% (1,663) | 1% (2,293) | 1% (2,362) | 1% (2,402) | 1% (2,250) | |
| Stage 1: Concerns reported to us and considered by AERT | No disability recorded | 99% (6,719) | 98% (6,187) | 99% (6,622) | 98% (6,842) | 98% (7,722) | 98% (8,389) |
| Disability recorded | 2% (141) | 2% (106) | 3% (181) | 2% (149) | 37% (2,536) | 2% (166) | |
| Stage 2: Concern passes test for investigation | No disability recorded | 98% (2,517) | 98% (1,609) | 97% (1,320) | 97% (1,316) | 98% (1,409) | 98% (1,428) |
| Disability recorded | 2% (62) | 2% (38) | 3% (37) | 3% (34) | 2% (23) | 2% (29) | |
| Stage 3 (path A): Cases where we took regulatory action (either by AERT or as a result of an investigation) | No disability recorded | * | * | 97% (251) | * | 97% (256) | 98% (523) |
| Disability recorded | * | * | 3% (7) | * | 3% (9) | 2% (9) | |
| Stage 4 (path B): Cases concluded at the SDT | No disability recorded | * | 95% (123) | * | * | * | * |
| Disability recorded | * | 5% (6) | * | * | * | * |
The tables in this section show the diversity breakdown of the practising population, made up of:
- solicitors on the roll who hold a current practising certificate
- registered European lawyers, registered foreign lawyers or exempt European lawyers
- depending on the role, some non-lawyers, such as managers and compliance officers.
The data is based on a 'snapshot' taken on 1 November 2024 from data provided by individuals through their mySRA accounts. The practising population as of this date was made up of 173,906 people.
As the reports and cases considered in this report are from 2023/24, this was the most appropriate data source against which to compare the diversity profile of individuals represented in our enforcement processes.
When looking at the practising population, the known population for each of the four diversity characteristics ranges from 64% (for ethnicity) to 100% (for age). Except data about age, diversity data is taken from individual mySRA accounts, where it is not mandatory for people to declare their diversity characteristics. Age data is taken from mandatory date of birth information individuals have to provide when they apply to be admitted as a solicitor.
Sex
Sex was known for 136,424 individuals representing 78% of the practising population as of 1 November 2024. Women made up 53% (72,240) and men made up 47% (64,174) of the known practising population.
Ethnicity
Ethnicity was known for 111,208 individuals representing 64% of the practising population as of 1 November 2024.
| Ethnicity | White | Asian | Black | Mixed | Other |
|---|---|---|---|---|---|
| Practising population | 81% (89,885) | 13% (13,984) | 3% (3,297) | 2% (2,206) | 2% (1,836) |
Age
Age was known for 173,864 individuals which when rounded, represents 100% of the practising population as of 1 November 2024.
| Age | 16–24 | 25–34 | 35–44 | 45–54 | 55–64 | 65+ |
|---|---|---|---|---|---|---|
| Practising population | 0% (412) | 24% (41,459) | 31% (54,248) | 25% (43,782) | 15% (25,254) | 5% (8,709) |
Disability
One per cent of the practising population declared a disability, made up of 2,250 individuals out of 173,906.