
Investigations and Enforcement – Diversity Monitoring Annual Report 2024/25
October 2026
About this report
Monitoring the diversity of individuals in our enforcement processes and acting on the findings is a vital part of embedding equality, diversity and inclusion in the work we do. We publish a diversity breakdown of individuals in our enforcement processes every year as part of our corporate reporting.
We have provided a breakdown by sex, ethnicity and age of individuals in our enforcement processes during the reporting year 2024/25. In previous years we have included analysis by disability, but this year, following a data cleansing exercise, the overall declaration rate for disability (11%) is too low for us to report on.
Our analysis covers two aspects of our enforcement work:
- individuals named on concerns reported to us and the regulatory activity we and the Solicitors Disciplinary Tribunal (SDT) take against individuals in the reporting year
- individuals who had a condition imposed on their practising certificate.
Individuals in our investigation and enforcement processes
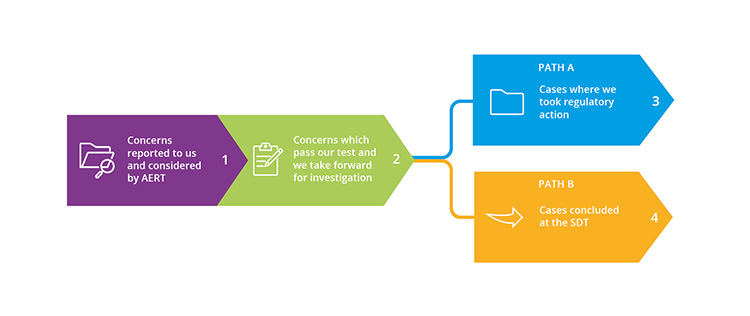
For the analysis of this part of our report, we have looked at four stages of our investigation and enforcement processes. Individuals may be counted multiple times if they are named on more than one concern. The numbers involved at the four stages of these processes in 2024/25 are set out below:
- Stage 1 – 11,454 individuals named on concerns reported to us which are considered by our Assessment and Early Resolution Team (AERT).
- Stage 2 – 1,981 individuals named on concerns which passed our assessment threshold test and which we took forward for an investigation.
- Stage 3 (path A) – 504 individuals named on cases where we took regulatory action (either by AERT or as a result of an investigation).
- Stage 4 (path B) – 109 individuals named on cases which were concluded at the SDT by way of a hearing or an agreed outcome.
The diagram below illustrates these stages and paths.
Our focus is the regulatory activity taken in the reporting year (from 1 November 2024 to 31 October 2025). The analysis does not follow the progress of a single cohort of individuals over time through the various stages of our investigation and enforcement processes.
To identify if there are any disparities by sex, ethnicity or age at stage 1, we compare individuals reported to us at stage 1, with the practising population as it was on 1 November 2025. To identify if there are any disparities by sex, ethnicity or age at stage 2, we compare individuals who pass our assessment test and are taken forward for investigation (stage 2) with those at stage 1. Many, but not all, of the individuals reported to us in 2024/25 (captured in the stage 1 analysis) will also be in the stage 2 analysis of investigations. This is because we generally decide whether to investigate a reported concern within two months of receiving it. The overlap between stage 1 and stage 2 is likely to be smaller in 2024/25, because there was an increase in the number or reports during the year, which meant it generally took longer for us to complete the assessment stage.
To identify if there are any disparities by sex, ethnicity or age at stages 3 and 4, we compare individuals who were subject to regulatory action (respectively by us or the SDT) with those taken forward for investigation (stage 2). It usually takes longer than a year for an investigation to be concluded, and an outcome reached. This means it is unlikely that many of the individuals who were reported to us in 2024/25 are represented in the regulatory action we take in the same year (captured in the stage 3 analysis), or in the decisions made by the SDT in that year (captured in the stage 4 analysis).
We also look at the different types of regulatory action taken at stages 3 and 4. To do this we compare the breakdown of all the individuals at stage 3, with the breakdown of those individuals who were subject to each type of regulatory action. For example, if men made up 50% of all individuals at stage 3, we might also expect them to make up around 50% of individuals who were issued advice, and around 50% of individuals who we sanctioned with a rebuke etc. This allows us to see whether there are any disparities in the types of regulatory action taken by sex, ethnicity and age, relative to the proportion of each group in stage 3 overall.
At stage 4, we look at how the SDT outcome was reached. The SDT rules allow for a case to be resolved by way of an agreed outcome. Agreed outcomes are agreements to settle a case reached between us and the individual accused of misconduct. Agreed outcomes have to be approved by the SDT. For this analysis, we compare the breakdown of those individuals whose case was concluded by agreed outcome and those whose case was concluded by a hearing.
Individuals with a condition on their practising certificate
The report also covers the conditions we imposed on a solicitor's practicing certificate in 2024/25, which involved 206 individuals in the reporting year.
A practising certificate condition restricts or prevents a solicitor from carrying out certain activity. To provide a complete picture covering all the conditions we imposed over the reporting year, we are reporting these separately. This is because not all of conditions are imposed as part of the investigation and enforcement process described above.
There are typically three situations in which we impose practising conditions:
- A condition imposed as an outcome to an investigation where we have made a finding of misconduct.
- An interim condition, which we impose during an investigation and pending the final outcome of an investigation to limit risk of harm to the public. We will monitor these conditions as we progress an investigation.
- A condition imposed (or reimposed) where we are satisfied that the individual is unsuitable to undertake certain activities or otherwise presents a risk to the public interest. These conditions are imposed (or reimposed) under our Authorisation rules, often at practising certificate renewal, and are not necessarily linked to an investigation.
The SDT can also impose conditions on firms or solicitors but for this report, we have not been able to include individuals who had conditions imposed by the SDT, as the numbers involved are too small to report on.
To identify if there are any disparities by sex, ethnicity or age, we compare individuals who had a condition imposed on their practising certificate with the practising population as it was on 1 November 2025. Because some conditions are imposed outside the investigation and enforcement processes, we consider this to be the most accurate comparator group.
Key findings from 2024/25
In this section, we focus on the findings from our analysis of data covering 2024/25 which are statistically significant. Testing for statistical significance means we can be reasonably confident that the observed differences were not due to random chance alone. We use the terms 'overrepresentation' and 'underrepresentation' here and in the sections below, only where we have observed differences which were statistically significant.
In the sections below, we have published a full set of the data from which these key findings have been extracted. We provide more information about the data and our approach to analysing each stage of our enforcement process and the conditions we imposed over the reporting year.
The findings seen in the data for 2025 are similar to previous years. The findings are more reliable for stages 1 and 2 because these stages involve much larger numbers. Although we have highlighted the statistically significant findings for stages 3 and 4 of our investigation and enforcement processes and for practising certificate conditions, these findings are less reliable.
Individuals in our investigation and enforcement processes
The key findings for individuals in our investigation and enforcement processes at stages 1 (reports received) and stage 2 (passed our assessment test and taken forward for investigation) in 2024/25 were:
- Men were overrepresented at stages 1 and 2. Compared with their respective proportion in the practising population (46%), they made up 63% of individuals named on concerns reported to us (stage 1) and 73% of individuals named on cases taken forward for investigation (stage 2).
- Black, Asian and minority ethnic individuals (as one group) were overrepresented at stages 1 and 2. Compared with their respective proportion in the practising population (20%), they made up 27% of individuals named on concerns reported to us (stage 1) and 40% of individual cases taken forward for investigation (stage 2).
- We have set out data for the various age categories in the sections below. In general terms, the older categories (individuals aged 45–65+) were overrepresented at stages 1 and 2 and the younger categories (individuals aged 25–44) were underrepresented.
At stages 3 and 4, where we or the SDT (respectively) took regulatory action, for the most part, the proportion of individuals by sex, ethnicity and age were similar to the proportions which were taken forward for investigation (stage 2). We have highlighted where the differences for each group are statistically significant, but it is important to note nevertheless, that when breaking down the total number of individuals at stages 3 (504) and 4 (109) the groups can become small. This means we need to treat the following findings with caution. The key findings which were statistically significant at these two stages were:
- At stage 3, Black, Asian and minority ethnic individuals were underrepresented in two types of regulatory action we imposed - they made up 21% of those given advice (seven individuals) and 21% of those given warnings (11 individuals), compared with their proportion overall at stage 3 (39%, involving 138 individuals).
- At stage 3, when looking at the regulatory action we took to intervene into an individual’s practice, there was overrepresentation of individuals aged 65 and over (38%, involving 18 individuals) compared with the overall proportion of this age group at stage 3 (19%, involving 89 individuals). There was underrepresentation of those aged 45–64 whose practice was intervened into (involving 17 individuals).
- At stage 4, White individuals were overrepresented across those who concluded their case at the SDT by agreed outcome (45%, involving 26 individuals) compared with Black, Asian and minority ethnic individuals (18%, involving six individuals). Black, Asian and minority ethnic individuals were overrepresented across those who concluded their case by SDT hearing (82%, involving 28 individuals) compared with White individuals (55%, 32 individuals).
- At stage 4, older individuals aged 45–65+ were underrepresented across those who concluded their case at the SDT by agreed outcome (35%, involving 28 individuals) compared with younger individuals aged 25–44 (46%, involving 13 individuals). Older individuals were overrepresented across those who concluded their case by SDT hearing (65%, involving 52 individuals), compared with younger individuals (54%, involving 15 individuals).
Individuals with a condition on their practising certificate
We have highlighted where the differences for each group are statistically significant, but it is important to note nevertheless, that when breaking down the total number of individuals who had conditions imposed (206) the groups can become small. This means we need to treat the following findings with caution.
The key findings for individuals on whom we imposed practising conditions were:
- Men were overrepresented across individuals on whom we imposed a practising condition (80%, involving 164 individuals), compared with their proportion in the practising population (46%).
- Black, Asian and minority ethnic individuals (as one group) were overrepresented across individuals on whom we imposed a practising condition (50%, involving 93 individuals) compared with their proportions in the practising population (20%).
- Individuals aged 45 and over were overrepresented (180 individuals) and individuals aged 16–44 (26 individuals) were underrepresented compared with their proportions in the practising population.
Our response
We carry out this diversity monitoring every year and report the findings so we can track trends. This report sets out the data and analysis for 2024/25, it does not explore the reasons why some groups may be overrepresented in our enforcement processes.
We are taking steps to better understand the reasons so we can address the potential causes of these concerning patterns. We commissioned research to provide insight into the factors driving this overrepresentation. We looked, in particular, at the overrepresentation of Black, Asian and minority ethnic individuals at stages 1 and 2, where our annual monitoring has consistently identified statistically significant disparities. The research was carried out by academics at the universities of York, Cardiff and Lancaster and involved an in-depth analysis of our data over four years, from 2018 to 2022. The researchers looked at the structural and other factors present in the legal profession and wider society which might be causing the overrepresentation.
The research findings were published in October 2024. Although the research provides insight into the factors which affect the overrepresentation of Black, Asian and minority ethnic solicitors, the picture is complex. One of the factors identified by the research was the size of firm where a solicitor works, which had a significant impact on the relative likelihood of being reported to and investigated by us. The researchers found that this is likely to have an impact on the overrepresentation of Black, Asian and minority ethnic solicitors as they are more likely than White solicitors to work in smaller firms.
As our data showed there was overrepresentation at the assessment stage, we also asked the researchers to review our assessment test and processes. The researchers concluded that our assessment processes were 'for the most part, as robust as they can be'. We agreed to take steps to further strengthen our approach at the assessment stage and we are implementing the commitments we made when publishing the research.
We recognise that the actions we are taking as a result of the research are unlikely to reverse the overrepresentation in the short term. But we are concerned that this latest report shows the overrepresentation of Black, Asian and minority ethnic individuals has increased at the assessment stage. In 2023/24, minority ethnic individuals made up 33% of those taken forward for investigation (compared with 26% of the individuals reported to us) and in 2024/25 that had risen to 40% (compared with 27% of the individuals reported to us).
We will be carrying out further work to understand the reasons for this increase, including looking more closely at how the sharp increase in the number of reports made to us over the reporting year may have affected this position. The number of individuals named on reports received rose from 8,555 in 2023/24 to 11,454 in 2024/25 and the number of individuals taken forward for investigation rose from 1,457 to 1,981. We have been taking steps to understand the reasons for this increase and have identified a number of factors which may have had an indirect impact on the increased overrepresentation of minority ethnic solicitors.
In addition to the work we are doing to strengthen our approach to the assessment stage, which includes improved quality assurance, we are also planning a wider review of our end-to-end enforcement process and will carry out a detailed equality impact assessment of the proposed changes to ensure that we focus on promoting equality and supporting our work to tackle overrepresentation.
This report is about the diversity of individuals subject to our investigation and enforcement work from 1 November 2024 to 31 October 2025.
Our focus for this annual report is the regulatory activity taken in the reporting year. It does not follow the progress of a single cohort of individuals through the various stages of our investigation and enforcement processes.
Many, but not all, of the individuals reported to us in 2024/25 (captured in the stage 1 analysis) will also be in the stage 2 analysis of investigations. This is because we generally decide whether to investigate a reported concern within two months of receiving it. The overlap between stage 1 and stage 2 is likely to be smaller this year, because there was an increase in the number or reports which meant that it generally took longer for us to complete the assessment stage.
It usually takes longer than a year for an investigation to be concluded and an outcome reached. This means it is unlikely that many of the individuals who were reported to us in 2024/25 are represented in the regulatory action we take in the same year (captured in the stage 3 analysis), or in the decisions made by the SDT in that year (captured in the stage 4 analysis). Individuals whose cases were concluded with regulatory action in 2024/25 will have been reported to us in previous years.
In relation to practising conditions, the report covers the conditions we imposed over the reporting year.
Comparison with the practising population
We have compared our data for 2024/25 with the practising population as it was on 1 November 2025. This data is set out in the 'Diversity profile of the practising population' section. We only include the known population – that is, the individuals for whom we hold diversity information. This varies at each stage of the process, but we have diversity information about:
- 99.98% of the practising population (this is shown as 100% due to rounding) in relation to age
- 68% of the practising population in relation to sex
- 62% of the practising population in relation to ethnicity.
A higher disclosure rate increases both the numbers available for analysis, and our confidence in the reliability of the findings.
In previous years we have included a breakdown by disability, but we have not been able to include this in 2024/25. Because of the way we collected disability data in the past, we were not able to differentiate between individuals who had actively declared they do not have a disability and those who had simply not answered the question. In 2025, we 'cleansed' the data we hold for disability, which meant resetting a large number of entries previously recorded as 'not disabled' to 'unknown'. Although our records are now more accurate, this has resulted in the declaration rate falling to 11% which means we cannot draw any meaningful conclusions from the data we have. We are working to improve declaration rates, by making the declaration process on mySRA easier to use, encouraging the profession to update their information through social media and direct email contact, and working with others to raise awareness of the importance of having good data.
Data about individuals
We have a role in regulating everyone working in a law firm, so we can and do investigate concerns about all individuals working in law firms, not just solicitors. When we use the term 'individuals' in our investigation and enforcement processes, this includes practising solicitors, lawyers from overseas, paralegals, legal secretaries, non-lawyer managers and others working in law firms. All these individuals can be included in the overall count of people at the various stages of our process. However, we do not have diversity data for individuals who are not solicitors so we cannot include them in our analysis by diversity group.
Ethnicity groups
We break ethnicity down into five main groups in line with the approach taken by the Office for National Statistics. These are: Asian, Black, Mixed, White and Other ethnic groups. Where the numbers in each group are large enough to report without the risk of identifying individuals, we report data about each group separately. Where the numbers are too small (at stages 3 and 4 and where we report on practising conditions), we compare the White group (which includes minority White groups) to the other four groups, which we refer to as the Black, Asian and minority ethnic group.
Dealing with small numbers
We have provided both the number of individuals involved as well as the percentage breakdown, which makes it clear where the numbers in this analysis are small. The number of individuals against whom we took regulatory action at stage 3 (504), or who were named on cases concluded at the SDT at stage 4 (109) in the reporting period can be small when broken down by diversity group. This is also the case for those upon whom we imposed practising conditions in the reporting year (206). Whilst we have noted where the differences between groups are statistically significant, it is nevertheless important to be cautious in drawing conclusions when numbers are small.
To safeguard confidentiality, we do not include the analysis when the numbers in the groups, when broken down, are less than five.
This section covers:
- Stage 1 – individuals named on concerns reported to us.
- Stage 2 – individuals named on concerns which passed our assessment threshold test and were taken forward for investigation.
The concerns we receive at stage 1 are considered for investigation at stage 2.
We focus on the concerns reported to us and assessment decisions made in 2024/25. Any patterns identified over the past six years at stages 1 and 2 are highlighted in the Investigation and enforcement – trends since 2018/19 section.
About the data
In 2024/25, 15,914 concerns were reported to us, 9,549 (60%) of which named one or more individuals (as opposed to firms). There were 11,454 individuals named on these concerns at stage 1. We counted an individual each time they were named, so some individuals may be counted more than once.
In the same period, 1,981 individuals were taken forward for investigation (stage 2). Many, but not all, of these individuals will be included in the group of individuals making up stage 1. However, some of those considered at stage 2 in 2024/25 will have been reported to us in 2023/24.
Broken down by three diversity characteristics (sex, ethnicity and age), the charts and tables in this section show:
- the practising population
- stage 1 – individuals named on concerns reported to us in 2024/25
- stage 2 – individuals taken forward for investigation in 2024/25.
Our findings
Sex
Men were overrepresented in the concerns reported to us at stage 1 (63%) when compared with the practising population (46%). They were also overrepresented at stage 2 (73%) compared with stage 1. Both of these differences are statistically significant.
Stages 1 and 2 – breakdown by sex in 2024/25
| Sex | Men | Women |
|---|---|---|
| Practising population | 46% (64,212) | 54% (74,170) |
| Stage 1: Concerns reported to us | 63% (5,929) | 37% (3,433) |
| Stage 2: Concern passes test for investigation | 73% (1,152) | 27% (418) |
The proportions in the table are based on the following data:
- Practising population – sex was known for 138,382 of the 182,482 individuals in the practising population (68%).
- Stage 1 – sex was known for 9,362 of the 11,454 individuals named on concerns we received (82%).
- Stage 2 – sex was known for 1,570 of the 1,981 individuals named on cases which passed our assessment threshold test and which were taken forward for investigation (79%).
In other words, based on the solicitor population on 1 November 2025, for every 100 women, we received 4.6 reports during 2024/25 and for every 100 men, we received 9.2 reports. For every 100 reports concerning women in 2024/25, 12.2 were taken forward in 2024/25. For every 100 reports concerning men, 19.4 were taken forward.
Ethnicity
The number of individuals counted at stages 1 and 2 of the process is large enough for us to show all five ethnic groups separately as we have in the chart below. This is not the case for stages 3 and 4, where the numbers are too small. We have, therefore, added the total for the Black, Asian and minority ethnic group in the table below, to allow for comparison across all stages of our processes.
Looking at the Black, Asian and minority ethnic group as a whole, there was an overrepresentation of individuals from this group reported to us at stage 1 (27%) compared with the practising population (20%). They were also overrepresented at stage 2 (40%) when compared with stage 1. Both of these differences are statistically significant.
The proportions for the Asian and Black groups are:
- Asian – 13% of the practising population, 19% of the individuals at stage 1 and 29% of individuals at stage 2
- Black – 3% of the practising population, 5% of individuals at stage 1 and 8% of the individuals at stage 2.
There was an underrepresentation of White individuals at stage 1 (73%) compared with the practising population (80%). They were also underrepresented at stage 2 (60%) when compared with stage 1. Both of these differences are statistically significant.
Stages 1 and 2 – breakdown by ethnicity in 2024/25
| Ethnicity | White | Asian | Black | Mixed | Other |
|---|---|---|---|---|---|
| Practising population | 80% (90,810) | 13% (14,853) | 3% (3,531) | 2% (2,400) | 2% (2,006) |
| 20% (22,790) | |||||
| Stage 1: Concerns reported to us | 73% (5,945) | 19% (1,568) | 5% (419) | 1% (122) | 2% (137) |
| 27% (2,246) | |||||
| Stage 2: Concern passes test for investigation | 60% (829) | 29% (396) | 8% (113) | 1% (17) | 2% (26) |
| 40% (552) | |||||
The proportions in the table are based on the following data:
- Practising population – ethnicity was known for 113,600 of the 182,482 in the practising population (62%).
- Stage 1 – ethnicity was known for 8,191 of the 11,454 individuals named on concerns we received (72%).
- Stage 2 – ethnicity was known for 1,381 of the 1,981 individuals named on cases which passed our assessment threshold test and which were taken forward for investigation (70%).
Based on the solicitor population on 1 November 2025, for every 100 minority ethnic solicitors, we received 9.9 reports during 2024/25. For every 100 White solicitors, we received 6.5 reports.
For every 100 reports concerning minority ethnic solicitors, 24.6 were taken forward in 2024/25. For every 100 reports concerning White solicitors, 13.9 were taken forward.
Age
We have carried out statistical significance testing for the younger and older groups which shows that, as a whole, those aged 44 and under are underrepresented at stages 1 and 2 and the those aged 45 and over are overrepresented at stages 1 and 2.
Stages 1 and 2 – breakdown by age in 2024/25
| Age | 16–24 | 25–34 | 35–44 | 45–54 | 55–64 | 65+ |
|---|---|---|---|---|---|---|
| Practising population | 0.2% (415) | 24% (44,328) | 30% (55,155) | 25% (46,167) | 15% (27,057) | 5% (9,320) |
| Stage 1: Concerns reported to us | 0.5% (51) | 14% (1,640) | 25% (2,840) | 28% (3,178) | 21% (2,425) | 11% (1,195) |
| Stage 2: Concern passes test for investigation | 1% (10) | 10% (193) | 26% (489) | 27% (506) | 24% (454) | 13% (242) |
The proportions in the table are based on the following:
- Practising population – age was known for 182,442 of the 182,482 individuals in the practising population (100%).
- Stage 1 – age was known for 11,329 of the 11,454 individuals named on concerns we received (99%).
- Stage 2 – age was known for 1,894 of the 1,981 individuals named on cases which passed our assessment threshold test and which were taken forward for investigation (96%).
Based on the solicitors population on 1 November 2025, for every 100 solicitors aged 16–44 we received 4.5 reports during 2024/25. For every 100 solicitors aged 45+, we received 8.2 reports.
For every 100 reports concerning solicitors aged 16–44 in 2024/25, 15.3 were taken forward. For every 100 reports concerning solicitors aged 45+, 17.7 were taken forward.
This section concerns the individuals at stage 3 – those against whom we took regulatory action in the reporting year. Regulatory action includes:
- issuing a warning or advice*
- imposing a sanction, such as a rebuke or a fine
- intervening into an individual's practice
- imposing practising conditions
- making a section 43 or section 99 order
- cases where an individual agrees to be removed from the roll of solicitors.
*Please note, in 2023 we updated the name of these sanctions to better reflect the wording in our Standards and Regulations. Definitions of each type of regulatory action are explained in our Investigations and Enforcement Annual Report.
In this section, we first compare the breakdown at this stage with the breakdown of individuals named on cases which we took forward for investigation (stage 2). However, the individuals considered at stage 2 will not be the same individuals considered at stage 3. This is because investigations may not all be concluded within the same year they are received.
We then compare the overall proportions of each group at stage 3 with the proportions of those groups for each type of regulatory action. For example, if men made up 50% of all individuals at stage 3, we might also expect them to make up around 50% of individuals who were issued advice, and around 50% of individuals who we sanctioned with a rebuke etc. This allows us to see whether there are groups that are overrepresented in any regulatory actions that are taken by us, relative to the proportion of each group in stage 3 overall.
We focus on the cases closed in 2024/25 where we took regulatory action. Any meaningful patterns identified over the past six years at stage 3 are highlighted in the Investigation and enforcement – trends since 2018/19 section.
About the data
The first set of charts and tables show the breakdown of individuals at stages 1, 2 and 3. The second set of charts and tables provide a breakdown of individuals by the type of regulatory action taken at stage 3.
Breakdown of individuals at stages 1, 2 and 3
The first set of charts and tables for each diversity characteristic show the profile of the individuals at each of the following stages:
- stage 1 – individuals named on concerns reported to us in 2024/25
- stage 2 – individuals named on concerns which passed our assessment threshold test and which we took forward for an investigation in 2024/25
- stage 3 – individuals named on cases where we took regulatory action (either by AERT or as a result of an investigation).
There were 504 individuals against whom we took regulatory action at stage 3 in 2024/25.
Breakdown of individuals by type of regulatory action taken
The second set of charts and tables for each diversity characteristic show the profile of individuals by the type of regulatory action taken. There were 308 regulatory actions, relating to 304 individuals in the second table, covering:
- those to whom we issued a warning or advice
- those who we sanctioned with a rebuke or a fine
- those who were named in an intervention.
Individuals covered in the second set of charts and tables may have more than one regulatory action recorded against them. If so, they will appear more than once in the analysis.
We have not provided this breakdown for all types of regulatory action. The actions that are not included in the second set of charts and tables are:
- Practising conditions imposed, because they are included in a separate section: Conditions imposed on practising certificates.
- Section 43 or section 99 orders. This is because these orders are imposed on non-lawyers working in the law firms and businesses we regulate, and we do not hold diversity data for these individuals.
- Removal from the roll of solicitors by way of a regulatory settlement agreement. This is because the numbers are too small to report on.
Because these types of actions are not included in the second set of charts and tables, but the individuals they relate to are included in the total number of individuals at stage 3, the total number of individuals under each action type will not add up to the total number at stage 3. Additionally, the individuals included in the total number at stage 3 are only counted once even if they had multiple actions taken against them. However, individuals in the second set of tables and charts who had more than one regulatory action recorded against them will be counted under each type of regulatory action. This applies to every characteristic in this section.
Regulatory action taken by AERT
Most cases which pass our assessment threshold test are referred for an investigation, which will determine whether regulatory action is warranted.
In some cases, rather than referring the case for an investigation, regulatory action can be taken by AERT (issuing a warning or advice). This will only happen in cases which have passed the assessment threshold test. Typically, this only happens in cases where there has been a clear breach of our rules, but circumstances indicate there is no underlying concern in terms of the public interest and public protection.
Seventeen individuals were issued a warning or advice in these circumstances by AERT in 2024/25. They are included in the stage 3 analysis (because regulatory action was taken against them), but not in the stage 2 analysis (because they were not taken forward for an investigation).
Limits in the data we can report and the conclusions we can draw
To avoid the risk of individuals being identified from this analysis, there are limitations in what we have been able to report in this section due to the small numbers involved:
- We have not been able to report separately on the groups making up the Black, Asian and minority ethnic group.
- We have not been able to report on fines that we have issued by sex and age due to small numbers.
- We have grouped together the 16–24 and 25–34 age categories in the stage 3 analysis (set out in the first table concerning age). We have also grouped together the 16–34 and 35–44 age groups when looking at regulatory action taken (set out in the second table concerning age).
We have highlighted where the differences for each group are statistically significant, but it is important to note nevertheless, that when breaking down the total number of individuals at stage 3 (504) the groups can become small. This means we need to treat all the findings in this section with caution, including those which have been identified as statistically significant.
Our findings
Sex
Breakdown of individuals by sex at stages 1, 2 and 3 (path A) in 2024/25
At stage 2, 73% of individuals were men and 27% were women. At stage 3, these proportions were 76% and 24% respectively.
| Sex | Men | Women |
|---|---|---|
| Stage 1: Concerns reported to us | 63% (5,929) | 37% (3,433) |
| Stage 2: Concern passes test for investigation | 73% (1,152) | 27% (418) |
| Stage 3 (path A): Cases where we took regulatory action (either by AERT or as a result of an investigation) | 76% (296) | 24% (92) |
Of the 504 individuals named on cases where we took regulatory action at stage 3, sex was known for 388 (77%).
Breakdown by sex of individuals by type of regulatory action taken in 2024/25
The proportions by sex at stage 3 were 76% men and 24% women.
The proportion of men and women represented across the different types of regulatory actions varied. We are only able to show some of the regulatory actions taken in the table below as explained above. For those we can share, for interventions the breakdown was 81% men and 19% women, for warnings it was 71% men and 29% women, for rebukes it was 69% men and 31% women and for advice it was 65% men and 35% women.
| Sex | Men | Women |
|---|---|---|
| Stage 3 (path A): Cases where we took regulatory action (either by AERT or as a result of an investigation) * | 76% (296) | 24% (92) |
| Advice | 65% (24) | 35% (13) |
| Warning | 71% (42) | 29% (17) |
| Rebuke | 69% (20) | 31% (9) |
| Intervention | 81% (30) | 19% (7) |
* Please note that the total number of individuals under each action type will not add up to the total number at stage 3, because we are not able to include all types of regulatory action in our analysis (for more detail see the notes at the beginning of this section).
Sex was known for:
- 37 of the 40 individuals who were issued advice (93%)
- 59 of the 71 individuals who were issued a warning (83%)
- 29 of the 33 individuals who received rebukes (88%)
- 37 of the 48 individuals where an intervention took place into their practice (77%).
Ethnicity
Breakdown by ethnicity of individuals at stages 1, 2 and 3 (path A) in 2024/25
At stage 2, 40% of individuals were from a Black, Asian or minority ethnic background and 60% were from a White background. At stage 3, these proportions were 39% and 61% respectively.
| Ethnicity | White | Black, Asian and minority ethnic |
|---|---|---|
| Stage 1: Concerns reported to us | 73% (5,945) | 27% (2,246) |
| Stage 2: Concern passes test for investigation | 60% (829) | 40% (552) |
| Stage 3 (path A): Cases where we took regulatory action (either by AERT or as a result of an investigation) | 61% (213) | 39% (138) |
Of the 504 individuals named on cases where we took regulatory action at stage 3, ethnicity was known for 351 (70%).
Breakdown by ethnicity of individuals by type of regulatory action taken in 2024/25
The proportion of Black, Asian and minority ethnic individuals at stage 3 was 39%. The proportion of this group varied across the different types of regulatory actions. We are only able to show some of the regulatory actions taken in the table below as explained above. For those we can share: the proportion of minority ethnic individuals was 47% for fines, 39% for interventions, 22% for rebukes and 21% for both advice and warnings. The only statistically significant findings were the underrepresentation of minority ethnic individuals in advice and warnings compared with their proportion at stage 3 overall.
The proportion of White individuals at stage 3 was 61%. The proportion of this group varied across the different types of regulatory actions. For the regulatory actions we can share in the table below: the proportion of minority ethnic individuals was 79% for both advice and warnings, 78% for rebukes, 61% for interventions and 53% for fines.
| Ethnicity | White | Black, Asian and minority ethnic |
|---|---|---|
| Stage 3 (path A): Cases where we took regulatory action (either by AERT or as a result of an investigation) * | 61% (213) | 39% (138) |
| Advice | 79% (26) | 21% (7) |
| Warning | 79% (42) | 21% (11) |
| Rebuke | 78% (21) | 22% (6) |
| Fine | 53% (9) | 47% (8) |
| Intervention | 61% (22) | 39% (14) |
* Please note that the total number of individuals under each action type will not add up to the total number at stage 3, because we are not able to include all types of regulatory action in our analysis (for more detail see the notes at the beginning of this section).
Ethnicity was known for:
- 33 of the 40 individuals who were issued advice (83%)
- 53 of the 71 individuals who were issued a warning (75%)
- 27 of the 33 individuals who received rebukes (82%)
- 17 of the 22 individuals who received fines (77%)
- 36 of the 48 individuals where an intervention took place into their practice (75%).
Age
Breakdown by age of individuals at stages 1, 2 and 3 (path A) in 2024/25
We have carried out statistical significance testing for the younger and older groups which shows that, as a whole, those aged 44 and under are underrepresented at stage 3 and those aged 45 and over are overrepresented at stage 3, compared with their respective representation at stage 2.
| Age | 16-34 | 35–44 | 45–54 | 55–64 | 65+ |
|---|---|---|---|---|---|
| Stage 1: Concerns reported to us | 15% (1,691) | 25% (2,840) | 28% (3,178) | 21% (2,425) | 11% (1,195) |
| Stage 2: Concern passes test for investigation | 11% (203) | 26% (489) | 27% (506) | 24% (454) | 13% (242) |
| Stage 3 (path A): Cases where we took regulatory action (either by AERT or as a result of an investigation) | 7% (31) | 17% (79) | 27% (124) | 30% (136) | 19% (89) |
Of the 504 individuals named on cases where we took regulatory action at stage 3, age was known for 459 individuals (91%).
Breakdown by age of individuals by type of regulatory action taken in 2024/25
We are only able to show some of the regulatory actions taken in the table below, as explained above. The proportion of individuals in each age category receiving advice, warnings, and rebuke outcomes did not differ significantly by age from that of the stage 3 population overall.
In contrast, there were statistically significant differences by age in the proportion of intervention cases. Individuals in the 45–54 and 55–64 categories were both underrepresented across those whose practice was intervened into, compared with their proportion at stage 3 overall. Individuals in the 65+ category were overrepresented across those whose practice was intervened into compared with their proportion at stage 3 overall.
| Age | 16–44 | 45–54 | 55–64 | 65+ |
|---|---|---|---|---|
| Stage 3 (path A): Cases where we took regulatory action (either by AERT or as a result of an investigation) * | 24% (110) | 27% (124) | 30% (136) | 19% (89) |
| Advice | 26% (10) | 26% (10) | 28% (11) | 21% (8) |
| Warning | 29% (20) | 31% (21) | 24% (16) | 16% (11) |
| Rebuke | 41% (13) | 22% (7) | 22% (7) | 16% (5) |
| Intervention | 26% (12) | 17% (8) | 19% (9) | 38% (18) |
* Please note (1) that some percentages (along the rows) do not add up to 100% due to rounding and (2) that the total number of individuals under each action type will not add up to the total number at stage 3, because we are not able to include all types of regulatory action in our analysis (for more detail see the notes at the beginning of this section).
Age was known for:
- 39 of the 40 individuals who were issued advice (98%)
- 68 of the 71 individuals who were issued a warning (96%)
- 32 of the 33 individuals who received a rebuke (97%)
- 47 of the 48 individuals where an intervention took place into their practice (98%).
This section concerns individuals at stage 4 – those named on cases concluded at the SDT in the reporting year. We take the most serious cases to the SDT. It is the SDT that makes the decisions in the cases referred to in this section. It is independent of the SRA and can impose more severe sanctions than the SRA can. The sanctions include an unlimited fine for any category of rule breach, suspension or strike off.
In the first part of this section, we look at the breakdown of individuals named on cases concluded at the SDT and a breakdown of the sanctions imposed by the SDT. In the second part we look at how these outcomes were reached (whether the sanctions were imposed by an agreed outcome or following a hearing at the SDT).
About the data – breakdown of individuals and sanctions at the SDT
To provide context, we compare the breakdown of individuals named on cases concluded at the SDT (stage 4), with the breakdown of individuals named on cases which we took forward for investigation (stage 2). However, the individuals considered at stage 2 will not be the same individuals considered at stage 4. This is because cases will not all be investigated, referred to the SDT and concluded by the SDT within the same year. We focus on the cases referred for investigation and those heard at the SDT in 2024/25 in this section.
We then compare the overall proportions of each group at stage 4, with the proportions of those groups within each type of sanction taken by the SDT. For example, if men made up 50% of all individuals at stage 2, we might expect them to make up around 50% of individuals who were suspended, and around 50% of individuals who were struck off etc. This allows us to see whether there are any groups that are overrepresented in sanctions that are taken compared with the proportion of each group in stage 4 overall.
When considering the individuals at stage 4, there is a chart and two tables for each diversity characteristic. The chart shows the information from both tables. The first table shows the breakdown of individuals at stages 1, 2 and 4. The second table provides a breakdown of individuals by the type of SDT sanction imposed.
Breakdown of individuals at stages 1, 2 and 4
The first table for each diversity characteristic shows the profile of individuals at each of the following stages:
- stage 1 – individuals named on concerns reported to us in 2024/25
- stage 2 – individuals named on cases which passed our assessment threshold test and which we took forward for investigation in 2024/25
- stage 4 – individuals named on cases concluded at the SDT.
There were 109 individuals who were named on cases concluded at the SDT at stage 4 in 2024/25.
Breakdown of individuals by type of SDT sanction
The second table for each diversity characteristic shows the profile of individuals by the type of SDT sanction imposed. There were 105 cases concluded at the SDT in 2024/25. These concerned 109 individuals. We have discounted any decisions the SDT made concerning firms or against individuals where there was no order.
Limits in the data we can report and the conclusions we can draw
To avoid the risk of individuals being identified from this analysis, there are limitations in what we have been able to report in this section due to the small numbers involved:
- We have not been able to report separately on the groups making up the Black, Asian and minority ethnic group.
- We have not been able to show all the sanctions for all diversity characteristics. For, and sex and age we have only been able to report on strike offs. For ethnicity, we have only been able to report on suspensions and strike offs.
- We have grouped together the 25–34 and 35–44 age categories. There were no individuals from the 16–24 age group at stage 4.
- We have not included data relating to individuals against whom there were 'other' decisions – which include, for example, a reprimand or a section 43 order.
Because some of the sanctions are not included in the second set of charts and tables, but the individuals they relate to are included in the total number of individuals at stage 4, the total number of individuals under each sanction type will not add up to the total number at stage 4. Additionally, the individuals included in the total number at stage 4 are only counted once even if they had multiple sanctions taken against them. However, individuals in the second set of tables and charts who had more than one sanction recorded against them will be counted under each type of sanction. This applies to every characteristic in this section.
We have highlighted where the differences for each group are statistically significant, but it is important to note nevertheless, that when breaking down the total number of individuals at stage 4 (109) the groups can become very small. This means we need to treat all the findings in this section with caution, including those which have been identified as statistically significant.
Our findings – breakdown of individuals and sanctions at the SDT
Sex
Breakdown by sex of individuals at stages 1, 2 and 4 (path B) in 2024/25
The proportion of men at stage 2 was 73% and it was 78% at stage 4. The proportion of women was 27% at stage 2 and it was 22% at stage 3.
| Sex | Men | Women |
|---|---|---|
| Stage 1: Concerns reported to us | 63% (5,929) | 37% (3,433) |
| Stage 2: Concern passes test for investigation | 73% (1,152) | 27% (418) |
| Stage 4 (path B): Cases concluded at SDT | 78% (82) | 22% (23) |
Sex was known for 105 of the 109 individuals named on cases concluded at the SDT (96%).
Breakdown by sex of individuals by type of SDT sanction in 2024/25
We are only able to show the strike off outcomes in the table below for the reasons explained above. Men made up 73% of individuals who were struck off and 78% at stage 4. Women made up 27% of individuals who were struck off and 22% at stage 4.
| Sex | Men | Women |
|---|---|---|
| Stage 4 (path B): Cases concluded at SDT * | 78% (82) | 22% (23) |
| Strike off | 73% (27) | 27% (10) |
*Please note that the total number of individuals under each action type will not add up to the total number at stage 4, because we are not able to include all types of regulatory action in our analysis (for more detail see the notes at the beginning of this section).
Sex was known for 37 of the 38 individuals who were struck off (97%).
Ethnicity
Breakdown by ethnicity of individuals at stages 1, 2 and 4 (path B) in 2024/25
The proportion of individuals from a Black, Asian or minority ethnic background was 40% at stage 2 and 37% at stage 4. The proportion of White individuals was 60% at stage 2 and 63% at stage 4.
| Ethnicity | White | Black, Asian and minority ethnic |
|---|---|---|
| Stage 1: Concerns reported to us | 73% (5,945) | 27% (2,246) |
| Stage 2: Concern passes test for investigation | 60% (829) | 40% (552) |
| Stage 4 (path B): Cases concluded at SDT | 63% (58) | 37% (34) |
Ethnicity was known for 92 of the 109 individuals named on cases concluded at the SDT (84%).
Breakdown by ethnicity of individuals by type of SDT sanction in 2024/25
The proportion of Black, Asian and minority ethnic individuals at stage 4 was 37%. We are only able to show the strike off and suspension outcomes in the table below for the reasons explained above. Minority ethnic individuals made up 48% of suspensions and 27% of strike offs. The proportion of White individuals, at stage 4 was 63%. They made up 73% of strike offs and 52% of suspensions.
| Ethnicity | White | Black, Asian and minority ethnic |
|---|---|---|
| Stage 4 (path B): Cases concluded at SDT* | 63% (58) | 37% (34) |
| Suspension | 52% (12) | 48% (11) |
| Strike off | 73% (24) | 27% (9) |
*Please note that the total number of individuals under each action type will not add up to the total number at stage 4, because we are not able to include all types of regulatory action in our analysis (for more detail see the notes at the beginning of this section).
Ethnicity was known for 23 of the 27 individuals who were given a suspension (85%) and 33 of the 38 individuals who were struck off (87%).
Age
Breakdown by age of individuals at stages 1, 2 and 4 (path B) in 2024/25
We have carried out statistical significance testing for the younger and older groups which shows that, as a whole, compared to their respective proportions at stage 2, those aged 44 and under are underrepresented at stage 4 and those aged 45 and over are overrepresented at stage 4.
| Age | 25–44 | 45–54 | 55–64 | 65+ |
|---|---|---|---|---|
| Stage 1: Concerns reported to us | 40% (4,480) | 28% (3,178) | 21% (2,425) | 11% (1,195) |
| Stage 2: Concern passes test for investigation | 36% (682) | 27% (506) | 24% (454) | 13% (242) |
| Stage 4 (path B): Cases concluded at SDT | 26% (28) | 39% (42) | 20% (22) | 15% (16) |
Age was known for 108 of 109 individuals named on cases concluded at the SDT (99%).
Breakdown by age of individuals by type of SDT sanction in 2024/25
We are only able to show the strike off outcomes in the table below for the reasons explained above. There are differences in the proportions of individuals struck off for the different age groups compared with their representation at stage 2, but these differences are not statistically significant.
| Age | 25–44 | 45–54 | 55–64 | 65+ |
|---|---|---|---|---|
| Stage 4 (path B): Cases concluded at SDT | 26% (28) | 39% (42) | 20% (22) | 15% (16) |
| Strike off | 21% (8) | 37% (14) | 26% (10) | 16% (6) |
*Please note that the total number of individuals under each action type will not add up to the total number at stage 4, because we are not able to include all types of regulatory action in our analysis (for more detail see the notes at the beginning of this section).
Age was known for 38 out of the 38 individuals who were struck off (100%).
About the data – agreed outcomes
The SDT rules allow for a case to be resolved by way of an agreed outcome. Agreed outcomes are agreements to settle a case reached between us and the individual accused of misconduct (referred to as 'the respondent' at the SDT). Agreed outcomes have to be approved by the SDT.
The tables and charts in this section compare the diversity breakdown of those individuals whose case was concluded by agreed outcome and those whose case was concluded by a hearing. Of the 109 individuals whose cases were concluded at the SDT in 2024/25, 68 were concluded by a hearing and 41 by an agreed outcome.
Limits in the data we can report and the conclusions we can draw
To avoid the risk of the individuals being identified from this analysis, there are limitations in what we have been able to report in this section on age. Because of low numbers in some of the age categories we have grouped together the younger age categories (25–44) and the older age categories (45–65+). There were no individuals in the 16–24 age group at this stage.
There are very small numbers involved at in this analysis (109 individuals) which makes it difficult to draw conclusions when broken down by diversity group.
Our findings – agreed outcomes
Agreed outcomes – breakdown by sex
The proportion of men and women whose cases were concluded by SDT hearing was 63% and 61% respectively. The proportion of men and women whose cases were concluded by way of an agreed outcome was 37% and 39% respectively.
| Sex | Cases concluded at SDT hearing | Cases concluded by SDT agreed outcome |
|---|---|---|
| Men | 63% (52) | 37% (30) |
| Women | 61% (14) | 39% (9) |
Sex was known for 39 out of 41 individuals named on cases concluded at the SDT by way of an agreed outcome (95%). It was known for 66 of the 68 individuals where a case was concluded by an SDT hearing (97%).
Agreed outcomes – breakdown by ethnicity
The proportion of Black, Asian and minority ethnic and White individuals who concluded their case at SDT hearing was 82% and 55% respectively. The proportion of Black, Asian and minority ethnic and White individuals whose cases were concluded by agreed outcomes was 18% and 45% respectively. These differences are statistically significant, although numbers were very small so the findings should be treated with caution.
| Ethnicity | Cases concluded at SDT hearing | Cases concluded by SDT agreed outcome |
|---|---|---|
| White | 55% (32) | 45% (26) |
| Black, Asian and minority ethnic | 82% (28) | 18% (6) |
Ethnicity was known for 32 of 41 individuals named on cases concluded at the SDT by way of an agreed outcome (78%). It was known for 60 of 68 individuals where a case was concluded by an SDT hearing (88%).
Agreed outcomes – breakdown by age
The proportion of younger and older individuals whose cases were concluded by SDT hearing was 54% and 65% respectively. The proportion of younger and older individuals whose cases were concluded by way of an agreed outcome was 46% and 35% respectively. These differences are both statistically significant, although numbers were small so the findings should be treated with caution.
| Age | Cases concluded at SDT hearing | Cases concluded by SDT agreed outcome |
|---|---|---|
| 25–44 | 54% (15) | 46% (13) |
| 45–65+ | 65% (52) | 35% (28) |
Age was known for all 41 individuals named on cases concluded at the SDT by way of an agreed outcome. It was known for 67 of 68 individuals named on cases concluded at the SDT (99%).
This section sets out the diversity breakdown of individuals where we imposed a condition on their practising certificate between 1 November 2024 and 31 October 2025. As this report is about the diversity breakdown of individuals, we have not included data about the conditions imposed on firms. We have not included information about conditions imposed by the SDT as numbers were too small.
About the data
In 2024/25, there were 211 cases where we imposed a condition on an individual's practising certificate. These cases involved 206 individuals. If an individual had more than one condition imposed on their practising certificate during the year, we have only counted them once for the purposes of this analysis. This is why there are fewer individuals when compared with cases.
Conditions restrict or prevent an individual from carrying out certain activity. There are typically three situations in which we impose practising conditions:
- A condition imposed as an outcome to an investigation where we have made a finding of misconduct.
- An interim condition, which we impose during an investigation and pending the final outcome of an investigation to limit risk of harm to the public. We monitor these conditions as we progress an investigation.
- A condition imposed (or reimposed) where we are satisfied that the individual is unsuitable to undertake certain activities or otherwise presents a risk to the public interest. These conditions are imposed (or reimposed) under our Authorisation rules, often at practice certificate renewal, and are not necessarily linked to an investigation.
Because we can impose conditions when a practising certificate is renewed or during an ongoing investigation, it is more meaningful to compare this data with the practising population, rather than one of the four stages set out earlier in the report.
Limits in the data we can report
To avoid the risk of the individuals being identified from this analysis, there are limitations in what we have been able to report in this section:
- We have not been able to report separately on the groups making up the Black, Asian and minority ethnic group due to the small numbers.
- There were no individuals aged 16–24 who had practising conditions imposed by us. We have grouped together the 16–24, 25–34 and 35–44 age categories in the conditions imposed by us, due to small numbers.
We have highlighted where the differences for each group are statistically significant, but it is important to note nevertheless, that when breaking down the total number of individuals who had a practising condition (206) the groups can become very small. This means we need to treat all the findings in this section with caution, including those which have been identified as statistically significant.
Our findings
Sex
Men were overrepresented across individuals on whom we imposed a practising condition (80%), compared with 46% of men in the practising population. Conversely, women were underrepresented across individuals on whom we imposed a practising condition (20%), compared with 54% of women in the practising population. Both of these differences were statistically significant.
| Sex | Men | Women |
|---|---|---|
| Practising population | 46% (64,212) | 54% (74,170) |
| Practising condition imposed | 80% (164) | 20% (41) |
The proportions in the table are based on the following data:
- Practising population – sex was known for 138,382 of the 182,482 in the practising population (68%).
- Practising condition imposed – sex was known for 205 of the 206 individuals who had a condition imposed (100% rounded up from 99.5%).
Ethnicity
Black, Asian and minority ethnic individuals were overrepresented across individuals on whom we imposed a practising condition (50%), compared with 20% in the practising population. Conversely, White individuals were underrepresented across individuals on whom we imposed a practising condition (50%), compared with 80% in the practising population. Both of these differences were statistically significant.
| Ethnicity | White | Black, Asian and minority ethnic |
|---|---|---|
| Practising population | 80% (90,810) | 20% (22,790) |
| Practising condition imposed | 50% (92) | 50% (93) |
The proportions in the table are based on the following data:
- Practising population – ethnicity was known for 113,600 of the 182,482 in the practising population (62%).
- Practising condition imposed – ethnicity was known for 185 of the 206 individuals who had a condition imposed (90%).
Age
Individuals aged 55 and over were overrepresented across individuals on whom we imposed a practising condition compared with their respective proportions in the practising population. This difference was statistically significant.
Individuals aged 44 and under were underrepresented across individuals on whom we imposed a practising condition compared with the practising population. This difference was statistically significant.
| Age | 16–44 | 45–54 | 55–64 | 65+ |
|---|---|---|---|---|
| Practising population | 55% (99,898) | 25% (46,167) | 15% (27,057) | 5% (9,320) |
| Practising condition imposed | 13% (26) | 31% (64) | 36% (75) | 20% (41) |
The proportions in the table are based on the following data:
- Practising population – age was known for 182,442 of the 182,482 practising population (100%).
- Practising conditions we imposed – age was known for 206 of the 206 individuals who had a condition imposed (100%).
This section sets out the diversity breakdown (by sex, ethnicity and age) of individuals at all four stages of the investigation and enforcement process (and the practising population) since 2018/19.
Breakdown by sex across the four stages of our enforcement process
The tables below show the full set of data across all stages of our enforcement processes broken down by sex. There have been limited changes over the past three years at stages 1 and 2.
The numbers at stages 3 and 4 are smaller, and it is important to be cautious when interpreting any trends at these stages. However, we note there was limited change at stage 3. At stage 4, although there was a dip in the middle year (2023/24) the proportion of men was the same in 2024/25 as it was in 2022/23.
Practising population
| Sex | 2018/19 | 2019/20 | 2020/21 | 2021/22 | 2022/23 | 2023/24 | 2024/25 |
|---|---|---|---|---|---|---|---|
| Men | 49% (74,657) | 48% (71,933) | 48% (70,928) | 47% (69,512) | 47% (68,244) | 47% (64,174) | 46% (64,212) |
| Women | 51% (77,539) | 52% (77,769) | 52% (78,011) | 53% (76,987) | 53% (76,136) | 53% (72,240) | 54% (74,170) |
Stage 1: Concerns reported to us and considered by AERT
| Sex | 2018/19 | 2019/20 | 2020/21 | 2021/22 | 2022/23 | 2023/24 | 2024/25 |
|---|---|---|---|---|---|---|---|
| Men | 67% (4,440) | 65% (3,959) | 62% (3,913) | 63% (3,894) | 63% (4,290) | 62% (4,509) | 63% (5,929) |
| Women | 33% (2,161) | 35% (2,088) | 38% (2,365) | 37% (2,336) | 37% (2,536) | 38% (2,715) | 37% (3,433) |
Stage 2: Concern passes test for investigation
| Sex | 2018/19 | 2019/20 | 2020/21 | 2021/22 | 2022/23 | 2023/24 | 2024/25 |
|---|---|---|---|---|---|---|---|
| Men | 73% (1,800) | 75% (1,166) | 68% (820) | 70% (804) | 72% (822) | 74% (832) | 73%(1,152) |
| Women | 27% (661) | 25% (380) | 32% (393) | 30% (352) | 28% (323) | 26% (295) | 27% (418) |
Stage 3 (path A): Cases where we took regulatory action (either by AERT or as a result of an investigation)
| Sex | 2018/19 | 2019/20 | 2020/21 | 2021/22 | 2022/23 | 2023/24 | 2024/25 |
|---|---|---|---|---|---|---|---|
| Men | 70% (159) | 73% (144) | 66% (105) | 74% (139) | 75% (151) | 75% (324) | 76% (296) |
| Women | 30% (67) | 27% (53) | 34% (55) | 26% (49) | 25% (50) | 25% (106) | 24% (92) |
Stage 4 (path B): Cases concluded at the SDT
| Sex | 2018/19 | 2019/20 | 2020/21 | 2021/22 | 2022/23 | 2023/24 | 2024/25 |
|---|---|---|---|---|---|---|---|
| Men | 85% (119) | 80% (99) | 73% (75) | 75% (61) | 78% (86) | 69% (55) | 78% (82) |
| Women | 15% (21) | 20% (25) | 27% (28) | 25% (20) | 22% (24) | 31% (25) | 22% (23) |
Breakdown by ethnicity across the four stages of our enforcement process
The tables below show the full set of data across all stages of our enforcement processes broken down by ethnicity. There has been little change in the proportion of minority ethnic solicitors at stage 1 over time, but an increase at stage 2 for this group over the past three years, from 29% in 2022/23, to 33% in 2023/24 to 40% in 2024/25.
The numbers at stages 3 and 4 are smaller, and it is important to be cautious when interpreting any trends at these stages. However, the proportion of minority ethnic solicitors has increased over the past three years for this group at stage 3, from 29% to 35% to 39%. There was an overall fall for this group at stage 4 over the past three years, from 41% to 36% to 37%.
Practising population
| Ethnicity | 2018/19 | 2019/20 | 2020/21 | 2021/22 | 2022/23 | 2023/24 | 2024/25 |
|---|---|---|---|---|---|---|---|
| White | 82% (99,098) | 82% (96,835) | 82% (99,078) | 81% (97,326) | 81% (95,626) | 81% (89,885) | 80% (90,810) |
| Black, Asian and minority ethnic | 18% (21,085) | 18% (20,930) | 18% (22,223) | 19% (22,266) | 19% (22,313) | 19% (21,323) | 20% (22,790) |
Stage 1: Concerns reported to us and considered by AERT
| Ethnicity | 2018/19 | 2019/20 | 2020/21 | 2021/22 | 2022/23 | 2023/24 | 2024/25 |
|---|---|---|---|---|---|---|---|
| White | 74% (4,273) | 74% (3,864) | 75% (4,138) | 76% (4,172) | 76% (4,558) | 74% (4,661) | 73% (5,945) |
| Black, Asian and minority ethnic | 26% (1,486) | 26% (1,327) | 25% (1,376) | 24% (1,307) | 24% (1,442) | 26% (1,645) | 27% (2,246) |
Stage 2: Concern passes test for investigation
| Ethnicity | 2018/19 | 2019/20 | 2020/21 | 2021/22 | 2022/23 | 2023/24 | 2024/25 |
|---|---|---|---|---|---|---|---|
| White | 68% (1,441) | 65% (870) | 67% (722) | 71% (727) | 71% (702) | 67% (668) | 60% (829) |
| Black, Asian and minority ethnic | 32% (691) | 35% (460) | 33% (356) | 29% (295) | 29% (291) | 33% (334) | 40% (552) |
Stage 3 (path A): Cases where we took regulatory action (either by AERT or as a result of an investigation)
| Ethnicity | 2018/19 | 2019/20 | 2020/21 | 2021/22 | 2022/23 | 2023/24 | 2024/25 |
|---|---|---|---|---|---|---|---|
| White | 65% (129) | 71% (114) | 64% (90) | 69% (116) | 71% (127) | 65% (240) | 61% (213) |
| Black, Asian and minority ethnic | 35% (68) | 29% (46) | 36% (51) | 31% (52) | 29% (52) | 35% (129) | 39% (138) |
Stage 4 (path B): Cases concluded at the SDT
| Ethnicity | 2018/19 | 2019/20 | 2020/21 | 2021/22 | 2022/23 | 2023/24 | 2024/25 |
|---|---|---|---|---|---|---|---|
| White | 65% (81) | 72% (81) | 66% (59) | 64% (47) | 59% (60) | 64% (44) | 63% (58) |
| Black, Asian and minority ethnic | 35% (43) | 28% (31) | 34% (31) | 36% (26) | 41% (42) | 36% (25) | 37% (34) |
Breakdown by age across the four stages of our enforcement process
The tables below show the full set of data across all stages of our enforcement processes broken down by age. There has been little change in the proportion for the various age categories at stages 1 and 2 over the period shown.
The numbers at stages 3 and 4 are smaller, and it is important to be cautious when interpreting any trends at these stages. However, it can be seen that there was an increase in the proportion of those aged 55–64 at stage 3 over the past three years (from 20% to 25% to 30%). In contrast the proportion of those aged 55–64 fell over the past three years at stage 4 (from 27% in 2022/23 and 2023/24 to 20% in 2024/25).
Practising population
| Age | 2018/19 | 2019/20 | 2020/21 | 2021/22 | 2022/23 | 2023/24 | 2024/25 |
|---|---|---|---|---|---|---|---|
| 16–34 | 25% (39593) | 24% (39,016) | 24% (38,927) | 23% (38,997) | 24% (40,628) | 24% (41,871) | 24% (44,743) |
| 35–44 | 32% (50885) | 33% (52,124) | 33% (53,371) | 33% (54,372) | 32% (55,305) | 31% (54,248) | 30% (55,155) |
| 45–54 | 24% (38033) | 24% (39,146) | 24% (39,788) | 25% (41,220) | 25% (42,734) | 25% (43,782) | 25% 46,167 |
| 55–64 | 14% (21378) | 14% (22,284) | 14% (22,787) | 14% (23,698) | 14% (25,009) | 15% (25,254) | 15% 27,057 |
| 65+ | 5% (7280) | 5% (7,736) | 5% (8,001) | 5% (8,485) | 5% (9,037) | 5% (8,709) | 5% (9,320) |
Stage 1: Concerns reported to us and considered by AERT
| Age | 2018/19 | 2019/20 | 2020/21 | 2021/22 | 2022/23 | 2023/24 | 2024/25 |
|---|---|---|---|---|---|---|---|
| 16–34 | 12% (826) | 13% (799) | 14% (911) | 14% (954) | 13% (1,042) | 14% (1,161) | 15% (1,691) |
| 35–44 | 26% (1,776) | 27% (1,680) | 26% (1,766) | 26% (1,794) | 26% (2,023) | 25% (2,118) | 25% (2,840) |
| 45–54 | 30% (1,992) | 28% (1,754) | 28% (1,915) | 27% (1,864) | 28% (2,188) | 28% (2,366) | 28% (3,178) |
| 55–64 | 22% (1,501) | 22% (1,403) | 21% (1,420) | 21% (1,439) | 21% (1,593) | 21% (1,789) | 21% (2,425) |
| 65+ | 10% (250) | 10% (616) | 11% (717) | 13% (867) | 12% (919) | 12% (982) | 11% (1,195) |
Stage 2: Concern passes test for investigation
| Age | 2018/19 | 2019/20 | 2020/21 | 2021/22 | 2022/23 | 2023/24 | 2024/25 |
|---|---|---|---|---|---|---|---|
| 16–34 | 11% (283) | 12% (190) | 10% (137) | 12% (165) | 12% (157) | 12% (161) | 11% (203) |
| 35–44 | 26% (659) | 29% (479) | 25% (335) | 26% (337) | 25% (334) | 24% (328) | 26% (489) |
| 45–54 | 30% (751) | 28% (447) | 29% (386) | 27% (349) | 29% (390) | 30% (405) | 27% (506) |
| 55–64 | 23% (567) | 22% (358) | 23% (304) | 21% (275) | 20% (269) | 19% (259) | 24% (454) |
| 65+ | 10% (250) | 9% (150) | 12% (162) | 14% (187) | 14% (195) | 15% (201) | 13% (242) |
Stage 3 (path A): Cases where we took regulatory action (either by AERT or as a result of an investigation)
| Age | 2018/19 | 2019/20 | 2020/21 | 2021/22 | 2022/23 | 2023/24 | 2024/25 |
|---|---|---|---|---|---|---|---|
| 16–34 | 13% (34) | 14% (34) | 19% (44) | 12% (28) | 11% (25) | 8% (38) | 7% (31) |
| 35–44 | 25% (64) | 28% (66) | 26% (60) | 22% (51) | 20% (47) | 19% (93) | 17% (79) |
| 45–54 | 27% (69) | 24% (56) | 25% (58) | 32% (73) | 25% (59) | 28% (141) | 27% (124) |
| 55–64 | 22% (55) | 20% (48) | 18% (43) | 16% (36) | 20% (48) | 25% (123) | 30% (136) |
| 65+ | 13% (33) | 14% (34) | 13% (30) | 18% (41) | 24% (57) | 20% (100) | 19% (89) |
Stage 4 (path B): Cases concluded at the SDT
| Age | 2018/19 | 2019/20 | 2020/21 | 2021/22 | 2022/23 | 2023/24 | 2024/25 |
|---|---|---|---|---|---|---|---|
| 16–34 | 9% (13) | 5% (6) | 7% (8) | 25% (21) * | 22% (24) * | 8% (7) | 7% (8) |
| 35–44 | 27% (38) | 25% (31) | 19% (21) | 20% (17) | 19% (20) | ||
| 45–54 | 31% (44) | 30% (38) | 31% (34) | 33% (28) | 31% (34) | 33% (27) | 39% (42) |
| 55–64 | 20% (28) | 25% (31) | 28% (31) | 24% (20) | 27% (30) | 27% (22) | 20% (22) |
| 65+ | 13% (18) | 16% (20) | 14% (15) | 18% (15) | 21% (23) | 12% (10) | 15% (16) |
* For 2021/22 and 2022/23, due to low numbers we combined the 16–34 and 35–44 age categories.
This section sets out the diversity breakdown (by sex, ethnicity and age) of individuals who had a practising condition imposed and the practising population since we started reporting on the data in this way in 2022/23.
There have been limited changes over the past three years for all three diversity characteristics.
Sex
Practising population
| Sex | 2022/23 | 2023/24 | 2024/25 |
|---|---|---|---|
| Men | 47% (68,244) | 47% (64,174) | 46% (64,212) |
| Women | 53% (76,136) | 53% (72,240) | 54% (74,170) |
Practising conditions imposed
| Sex | 2022/23 | 2023/24 | 2024/25 |
|---|---|---|---|
| Men | 77% (155) | 81% (172) | 80% (164) |
| Women | 23% (46) | 19% (41) | 20% (41) |
Ethnicity
Practising population
| Ethnicity | 2022/23 | 2023/24 | 2024/25 |
|---|---|---|---|
| White | 81% (95,626) | 81% (89,885) | 80% (90,810) |
| Black, Asian and minority ethnic | 19% (22,313) | 19% (21,323) | 20% (22,790) |
Practising conditions imposed
| Ethnicity | 2022/23 | 2023/24 | 2024/25 |
|---|---|---|---|
| White | 54% (93) | 44% (82) | 50% (92) |
| Black, Asian and minority ethnic |
46% (79) |
56% (105) | 50% (93) |
Age
Practising population
| Age | 2022/23 | 2023/24 | 2024/25 |
|---|---|---|---|
| 16–34 | 24% (40,628) | 24% (41,871) | 24% (44,743) |
| 35–44 | 32% (55,305) | 31% (54,248) | 30% (55,155) |
| 45–54 | 25% (42,734) | 25% (43,782) | 25% (46,167) |
| 55–64 | 14% (25,009) | 15% (25,254) | 15% (27,057) |
| 65+ | 5% (9,037) | 5% (8,709) | 5% (9,320) |
Practising conditions imposed
| Age | 2022/23 | 2023/24 | 2024/25 |
|---|---|---|---|
| 16-44 | 15% (31) | 13% (29) | 13% (26) |
| 45-54 | 29% (59) | 33% (72) | 31% (64) |
| 55-64 | 37% (75) | 33% (71) | 36% (75) |
| 65+ | 18% (37) | 21% (46) | 20% (41) |
The tables in this section show the diversity breakdown of the practising population, made up of:
- solicitors on the roll who hold a current practising certificate
- registered European lawyers, registered foreign lawyers or exempt European lawyers
- depending on the role, some non-lawyers, such as managers and compliance officers.
The data is based on a 'snapshot' taken on 1 November 2025 from data provided by individuals through their mySRA accounts. The diversity data section on mySRA was re-platformed in August 2025, making improvements to usability. The practising population as of this date was made up of 182,482 people.
As the reports and cases considered in this report are from 2024/25, this was the most appropriate data source against which to compare the diversity profile of individuals represented in our enforcement processes.
When looking at the practising population, the known population for each of the three diversity characteristics ranges from 62% (for ethnicity) to 100% (for age). Except data about age, diversity data is taken from individual mySRA accounts, where it is not mandatory for people to declare their diversity characteristics, though we encourage the profession to provide this information. Age data is taken from mandatory date of birth information individuals have to provide when they apply to be admitted as a solicitor.
Sex
Sex was known for 138,382 individuals representing 68% of the practising population as of 1 November 2025. Women made up 54% (74,170) and men made up 46% (64,212) of the known practising population.
During 2024/25 we made a change to the response categories available for the question about sex, to 'male' and 'female' (removing the 'other' category that was previously available). We reclassified the 'other' entries to 'unknown'. The 'unknown' category made up 32%.
Ethnicity
Ethnicity was known for 113,600 individuals representing 62% of the practising population as of 1 November 2025.
| Ethnicity | White | Asian | Black | Mixed | Other |
|---|---|---|---|---|---|
| Practising population | 80% (90,810) | 13% (14,853) | 3% (3,531) | 2% (2,400) | 2% (2,006) |
Age
Age was known for 182,442 individuals which when rounded, represents 100% of the practising population as of 1 November 2025.
| Age | 16–24 | 25–34 | 35–44 | 45–54 | 55–64 | 65+ |
|---|---|---|---|---|---|---|
| Practising population | 0% (415) | 24% (44,328) | 30% (55,155) | 25% (46,167) | 15% (27,057) | 5% (9,320) |